ISO 9001 Certified Manufacturer 360° Factory Tour

Blood oxygen sensing · Pulse oximeter optics

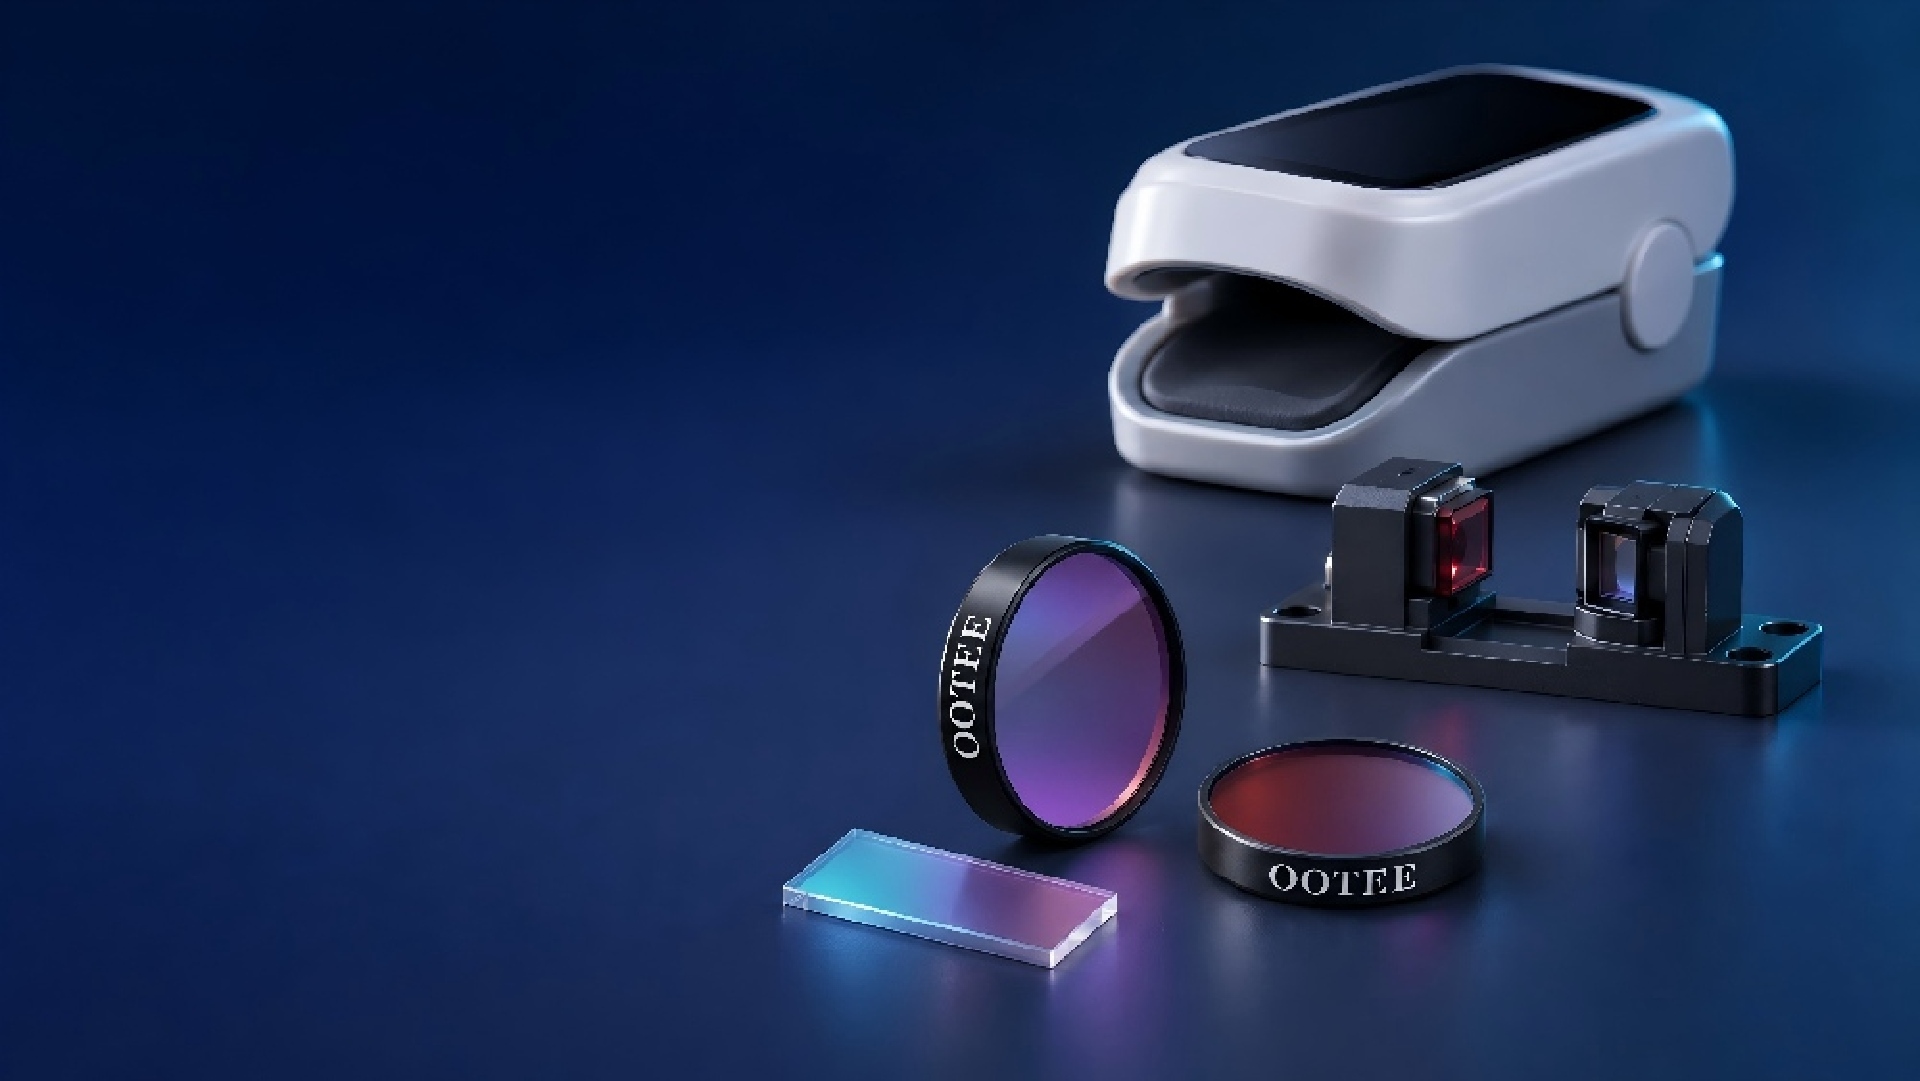
Pulse Oximeter Optical Filters

Matched to the red and near-infrared bands used for SpO2 measurement, improving the pulse oximeter optical path

For finger-clip pulse oximeters, SpO2 probes and wearable optical sensing modules. Working from the LED emission spectrum, the detector response and the actual assembly, we define a suitable transmission window and out-of-band blocking range to support signal collection, ambient-light management and module integration.

  • Red / NIR spectral match
  • Dual-band design
  • Out-of-band rejection
  • Miniature window integration
660 / 940 nm Common red and near-infrared measurement bands
OD3–OD5 Out-of-band blocking (to OD6)
φ3–φ50 mm Window diameter (by assembly)
SpO2 probe optical path with red and near-infrared sensing positions (schematic)
Optical path and sensing positions are schematic, not clinical results

What is a pulse oximeter optical filter?

A pulse oximeter optical filter is a wavelength-selective element placed in the SpO2 measurement path. Through its optical material or thin-film structure it transmits the bands required for measurement while reducing the share of non-target wavelengths that reach the detector. Depending on the system design, filtering can be provided by a discrete filter or integrated into the detector window or another optical cover.

Pulse oximetry uses the difference in absorption between oxygenated and deoxygenated haemoglobin in the red and near-infrared regions. Common systems use red light at around 660 nm and near-infrared light at around 940 nm, recording how the intensity changes after the light passes through or returns from tissue. Actual source wavelengths should follow the selected LED specification and the instrument design.

The role of the filter is to shape the spectral content reaching the detector and provide suitable optical conditions for signal collection. It does not calculate SpO2 and cannot on its own determine the accuracy of the instrument; the light source, photodetector, sampling circuitry, algorithm, fit on the patient and system calibration all contribute to the final result.

Note that not every pulse oximeter requires a discrete filter. Whether to add one, and which spectral structure to use, depends on the existing sensor package and on whole-instrument test results.

Measurement principle: from optical signal to SpO2 reading

SpO2 is not derived from comparing the absolute brightness of the two wavelengths, but from comparing how each signal varies with the pulse.

  1. 01

    Red and near-infrared light illuminates the tissue

    Light in both bands is affected by absorption and scattering in tissue. Blood components absorb the two bands to different degrees, which provides the optical basis for estimating blood oxygenation.

  2. 02

    The detector records the pulse-dependent signal

    The received signal contains a relatively stable background component and a component that varies with arterial pulsation. These are normally described as the DC and AC components.

  3. 03

    The system compares the relative change in both bands

    A common approach calculates the AC/DC ratio of the red and near-infrared signals and forms a ratio R; a calibration relationship then converts that ratio into an SpO2 estimate.

  4. 04

    Filtering and sampling control interference together

    In the usual time-multiplexed scheme the red and near-infrared LEDs are pulsed in sequence, and the system can sample the ambient background while the source is off. The optical filter handles wavelength selection; the electronics handle signal separation and background compensation. These are different tasks.

Red LED ≈ 660 nm NIR LED ≈ 940 nm Tissue Receiving window / filter Photo- detector Signal processing ① Emit: red and NIR pulsed in sequence ② Receive: filter selects bands, detector records AC / DC ③ Process: ratio R converted to SpO₂ by instrument calibration
Red / NIR LEDs → tissue → receiving window or filter → photodetector → signal processing → SpO2 display The filter position shown is schematic; the actual arrangement varies with transmissive, reflective and packaged configurations.

The role of the filter in SpO2 measurement

From transmission in the measurement bands to batch consistency, each aspect has its own selection criteria.

Design aspect Contribution Selection focus
Transmission in the measurement bands Lets the useful red and near-infrared signal reach the detector Whether the passband covers the actual LED emission spectrum
Out-of-band rejection Reduces the optical background contributed by non-target wavelengths Whether the blocking range covers the main interfering bands
Matching of the two bands Designed around the signal level of each path and the receiving dynamic range Transmission specified separately for red and near-infrared
Receiving-window integration Combines spectral selection with the window structure Thickness, clear aperture, mounting and surface requirements
Batch spectral consistency Controls the spectral spread between individual filters Passband edges, transmission and inspection conditions

A filter mainly suppresses light outside its passband. Ambient light that overlaps the measurement bands can still reach the detector, so the filter has to be designed together with structural light shielding, background sampling and signal processing.

Product options: choosing a filter structure for the optical path

The options below can be evaluated; the right choice depends on the system structure.

Option A

Red and near-infrared dual-band filter

Two transmission windows on a single element, covering the red and near-infrared measurement bands and suppressing light in the region between them and outside them. Suitable where both wavelengths share one receiving window. A dual-band filter passes both bands but does not separate the two signals; separation still relies on sampling timing or other system design.

Design focus
The range and transmission of both passbands, the blocking region between them, and angular tolerance.
Option B

Long-pass ambient-light filter

A short-wave cut-on edge reduces the shorter visible wavelengths reaching the receiver while keeping the red and near-infrared range. It can be evaluated as a broad transmission window, but unlike a dual-band structure it cannot set independent blocking regions between the two windows and on the long-wave side at the same time.

Design focus
Margin between the cut-on edge and the red LED emission spectrum, plus the long-wave response of the detector.
Option C

Channel-specific bandpass filters

For systems with separate receiving paths, a red bandpass and a near-infrared bandpass give each channel its own spectral selectivity. If the system uses a single shared detector, a single red bandpass filter will normally block the near-infrared measurement light as well, so the channel approach cannot simply be applied.

Design focus
Channel structure, target bands, rejection of non-target bands, and matching of the two responses.
Option D

Filter-integrated window

The filter coating is deposited on a substrate that also serves as the window, which can reduce the number of discrete optical parts in a miniaturised module.

Design focus
Substrate transmission, coating process compatibility, mounting stress, cleaning method and operating environment.

These are structural directions; the actual configuration in transmissive, reflective or packaged form has to be re-evaluated against the module and cannot be copied from the measurement wavelength alone.

Technical parameters and customisation

Matching more than the centre wavelength — matching the spectrum that actually reaches the detector. LEDs emit over a finite bandwidth and can shift with batch, temperature and operating conditions. A passband that is too narrow may lose useful light; one that is too wide may admit more non-target light. The design should balance useful signal, background light and the real incidence conditions.

Parameter Description / customisation
Measurement bands Based on the actual LED spectrum; 660 nm / 940 nm are common examples and the passband can follow the spectral width
Spectral structure Dual-band, long-pass, channel-specific bandpass, or filter-integrated window
Passband range Red 640–680 nm, NIR 920–960 nm (reference values; edges and tolerances set from the LED spectrum)
Passband transmission Red ≥85%, NIR ≥90% (reference values; can be specified per window)
Bandwidth definition Either FWHM or a guaranteed passband above a specified transmission
Blocking range and depth OD3–OD5 over 400–1100 nm outside the passbands; OD6 can be evaluated
Incidence conditions 0°–20° typical, up to ±30° on evaluation, agreed against the actual receiver geometry
Substrate Soda-lime glass / B270 / fused silica, assessed against band, thickness and process compatibility
Outline and size Round φ3–φ50 mm, square 3×3–30×30 mm (reference values with agreed tolerances)
Thickness 0.5–3.0 mm (reference value)
Clear aperture From 0.5 mm inside the outline, agreed against clamping and mounting
Operating environment −20–70 °C, RH ≤85%; cleaning method agreed against actual use

These are the ranges we normally produce. Requirements beyond them can be evaluated from drawings; final values are confirmed by sample and datasheet. The figures above are page reference values — the datasheet of the selected part governs supply.

Passband transmission

Describes how much light in the target band passes the filter. State clearly whether the figure is a peak, an average, or a minimum across the specified range.

Blocking depth (OD)

Describes attenuation in a specified band. It is not equivalent to the interference immunity or the measurement accuracy of the finished instrument.

Angle of incidence

The angle between the incoming ray and the surface normal. For interference filters, the actual angular distribution has to be assessed for its effect on spectral position and shape.

T% 100 0 nm 600660 800940 1050 Red LED NIR LED Band 1 Band 2 Blocking region ※ Design schematic only; windows set from LED spectrum and agreement
Dual-band spectral schematic: red and near-infrared LED spectra overlaid with filter transmission (design schematic, not measured data)
OD 54320 nm 4006609401100 660 nm 940 nm Blocking OD3–OD5 Short-wave side Long-wave side ※ Design schematic only; OD and wavelength range by agreement
Transmission and blocking schematic: out-of-band suppression outside the two measurement windows (design schematic, not measured data)

Applications and adaptation points

The same filter structure carries different requirements in different mechanical arrangements.

Application Optical path characteristics Filter design focus
Finger-clip pulse oximeters Usually transmissive, with emitter and receiver on opposite sides of the tissue Two-band transmission, receiving-window match, ambient-light management
SpO2 probes Depends on the probe body, measuring site and fixation method Filter outline, clear aperture and mechanical adaptation
Wearable SpO2 modules Usually reflective, with emitter and receiver on the same side Angular distribution, direct light leakage from source to detector, window integration
Multi-wavelength PPG research modules May include red, near-infrared and other bands Multi-window matching, sampling scheme and spectral compatibility
Transmissive (finger clip) LED 660 / 940 nm Tissue absorption Filter + detector (receiver) Emitter Receiver (opposite) ※ Emitter and receiver on opposite sides; light passes through tissue Reflective (wearable) LED 660/940 Filter + detector (same side as LED) Tissue (back-scattered) emitter and receiver in one plane Return Direct leakage needs blocking ※ Same-side layout; assess direct leakage and angular spread
Transmissive versus reflective geometry: position of emitter, tissue, filter and receiver (structural schematic)

Both transmissive and reflective structures are used for optical SpO2 sensing, but the propagation path and receiving conditions differ. The filter configuration has to be re-evaluated for each module and cannot be substituted on the basis of "the same measurement wavelength".

Custom process: from source data to sample validation

Requirement intake → spectral targets → sample approval → module validation → specification release

  1. 1

    Confirm source and detector

    Collect the LED emission spectrum, wavelength bins, operating conditions and detector response curve.

  2. 2

    Define the optical path and structure

    Establish transmissive or reflective geometry, filter position, receiving angle and available space.

  3. 3

    Set spectral targets

    Fix passbands, transmission, blocking ranges and tolerances, balancing signal loss against background suppression.

  4. 4

    Sample and module validation

    Check the filter spectrum, then test signal level, background response and behaviour under different conditions in the real module.

  5. 5

    Release the delivery specification

    Based on the validation results, agree drawings, acceptance criteria, batch inspection and packaging.

Frequently asked questions

Source Factory In-house coating lines, no middlemen
Ready to Ship Standard items dispatched same or next day
Quality Guaranteed 100 % inspected, spectral report included
Express Delivery DHL / FedEx worldwide