Original content by the OOTEE Optics editorial team, drawn from first-hand production line and inspection data. Please credit the source when republishing.
Given limits in expertise and test conditions, the theories, parameters and conclusions here carry no guarantee of absolute accuracy. For technical learning and exchange only - never the sole basis for design, acceptance or selection. Corrections welcome.
Choosing an optical bandwidth starts with the spectrum that must reach the detector. Center wavelength (CWL) locates the filter window; full width at half maximum (FWHM) measures its width at half the peak transmission. Neither specifies the entire interval over which a minimum transmission is guaranteed.
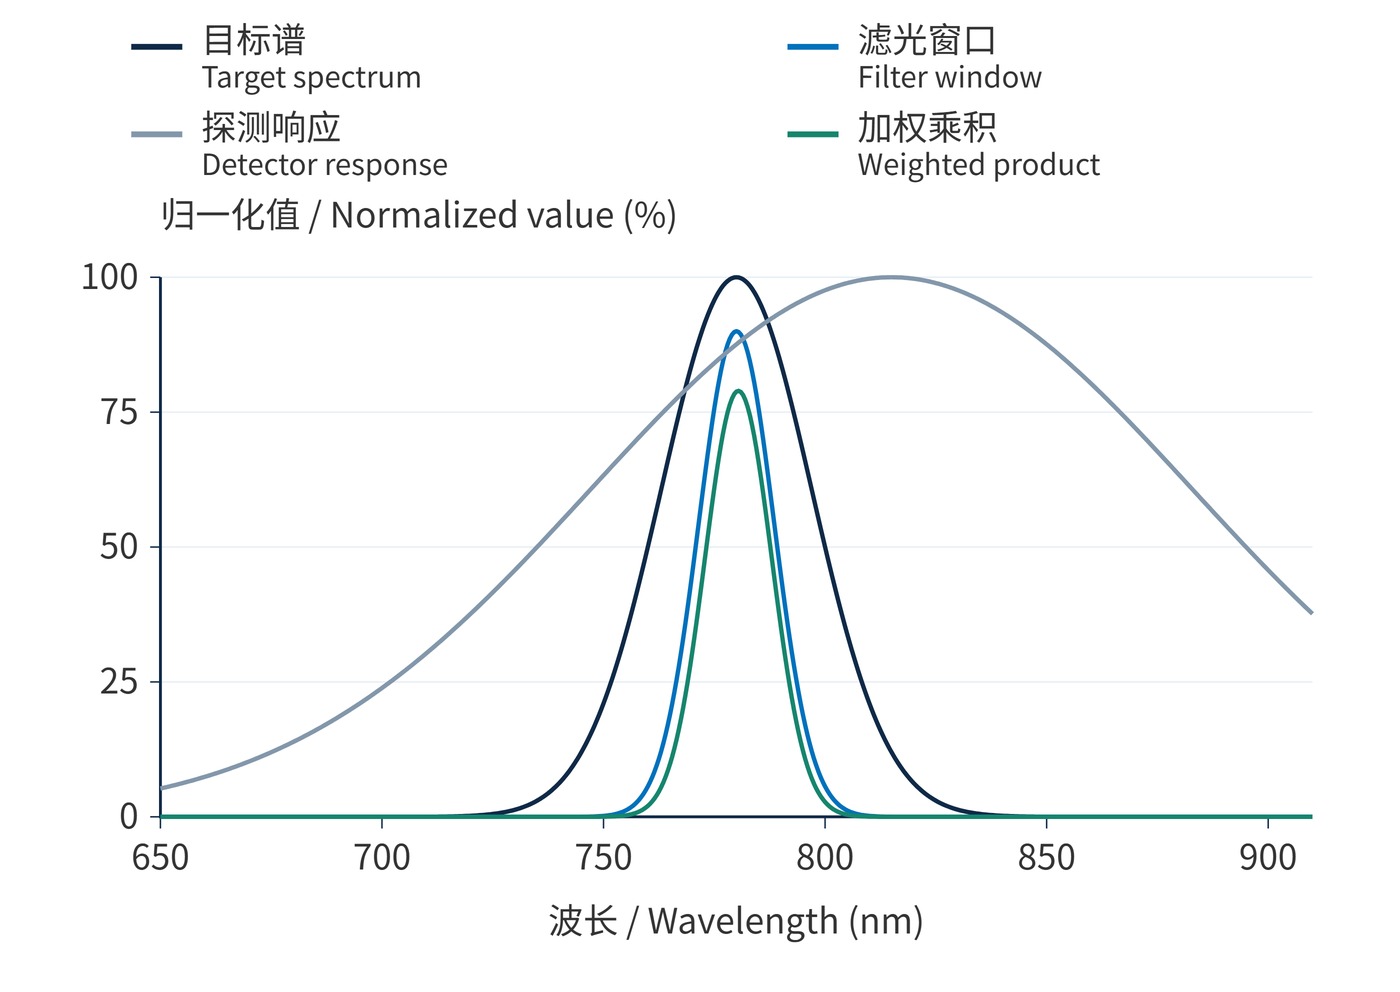
Use the target spectrum at the filter plane. In reflectance sensing, this includes the illumination spectrum and the sample reflectance. In fluorescence detection, use the emitted fluorescence spectrum rather than the excitation linewidth. Detector responsivity weights the transmitted spectrum, making the overlap of all three functions the useful quantity, as Fig. 1 illustrates.
For a linear photodiode, let $P_s(\lambda)$ be target spectral power density in $\mathrm{W/nm}$, $T(\lambda)$ the filter transmission, and $R(\lambda)$ detector responsivity in $\mathrm{A/W}$. With wavelength integrated in nm, the signal current is:
$$I_s=\int P_s(\lambda)T(\lambda)R(\lambda)\,\mathrm{d}\lambda$$
Replace $P_s$ with background spectral power density $P_b$ to calculate background current $I_b$. A photon-flux spectrum instead requires quantum efficiency to obtain electron counts; quantum efficiency and responsivity are not interchangeable. Fig. 1 normalizes the curves to compare their shapes, so it does not predict an absolute current.
A narrower window can reduce both signal and background. For shot noise plus independent electronic noise, a useful comparison is:
$$\mathrm{SNR}=\frac{I_s}{\sqrt{2q(I_s+I_b+I_d)B_e+i_e^2}}$$
Here $q$ is elementary charge, $I_d$ dark current, $B_e$ equivalent noise bandwidth in Hz, and $i_e$ the RMS electronic noise current integrated over that bandwidth. Electrical bandwidth is distinct from optical bandwidth in nm. Add other dominant noise sources separately. Once a background-limited receiver already collects the target spectrum, widening the window mainly adds noise.
Consider a Gaussian target spectrum with CWL 780 nm and FWHM 12 nm, and flat detector responsivity. Ideal rectangular windows with 90% transmission and widths of 10, 20 and 30 nm collect approximately 60.6%, 85.5% and 89.7% of the unfiltered signal. A 90% signal-retention requirement therefore leaves almost no loss allowance with this peak transmission.
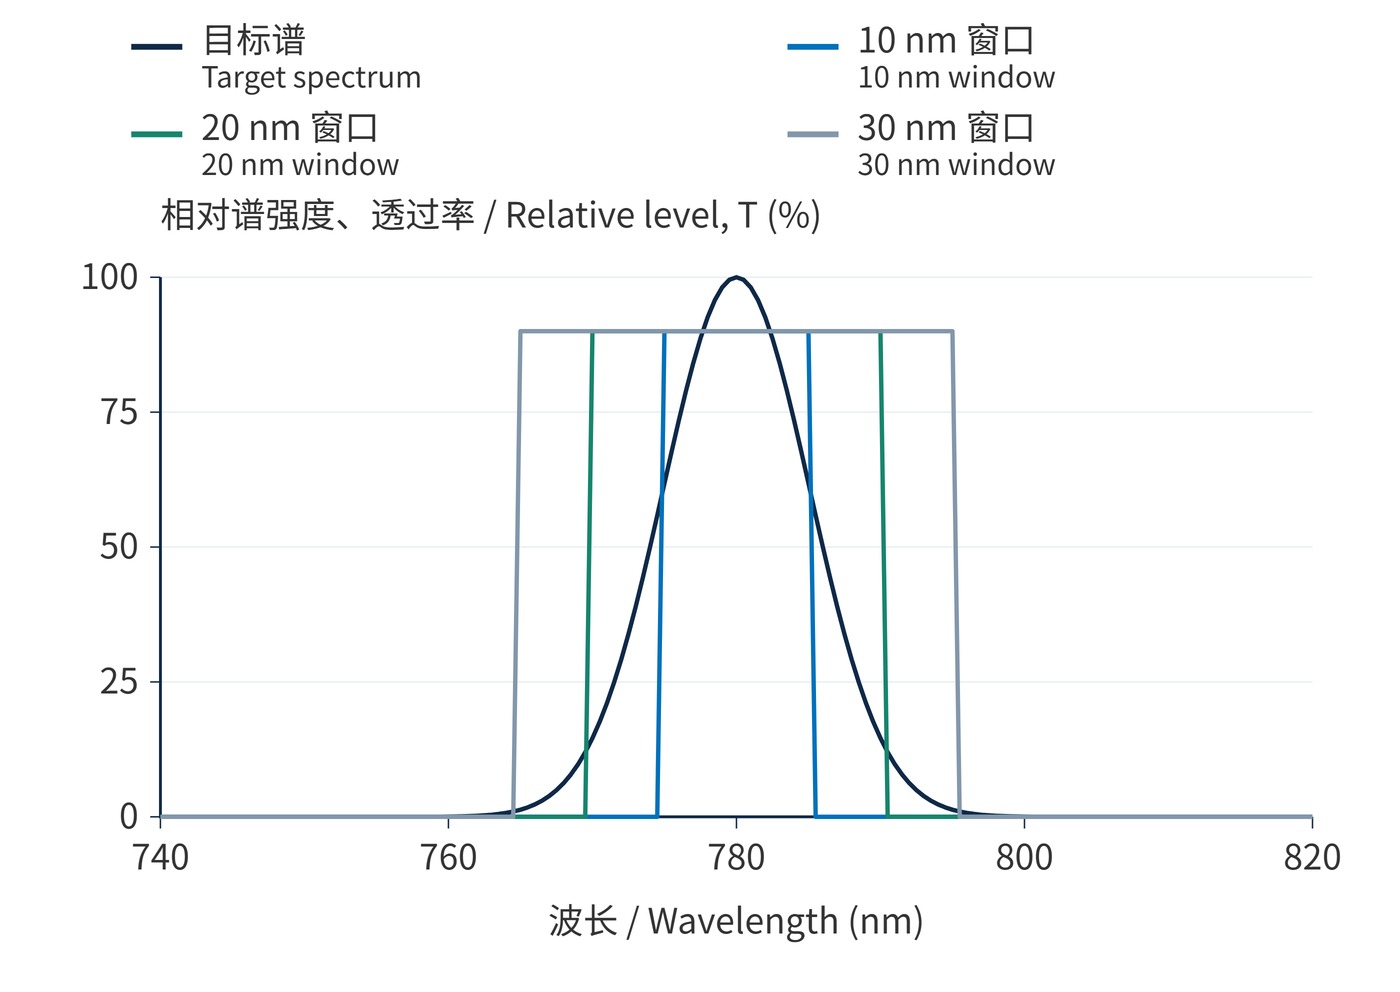
As Fig. 2 shows, moving from 20 to 30 nm yields little additional signal while increasing a flat background by 50%. These are illustrative integrals, not measured filter specifications. Recalculate with real slopes, leakage and drift. A preliminary coverage check for a nearly rectangular usable window is:
$$\frac{W_u}{2}\geq\frac{W_s}{2}+|\delta_{\mathrm{rel}}|_{\max}$$
$W_u$ is the width meeting minimum transmission, $W_s$ the required target interval, and $\delta_{\mathrm{rel}}$ relative center offset. Define an energy fraction before assigning a finite interval to a Gaussian spectrum. Combine systematic offsets in their worst direction; root-sum-square treatment requires a statistical justification.
| Application | Check first | Bandwidth decision |
|---|---|---|
| Laser sensing | Linewidth, mode hops and drift | Cover the envelope, then reject background |
| LED reflectance | Source spectrum times sample reflectance | Trade collected signal against background |
| Fluorescence | Emission, excitation leakage and crosstalk | Balance photon collection and channel separation |
For LED camera systems, evaluate machine vision filters against both illumination and sensor response. Broadband lighting may need a wider receiving window. In fluorescence, treat excitation leakage as a separate blocking constraint rather than maximizing emission throughput alone.
Centering the filter at the detector response peak can miss the target. Matching bandwidth to room-temperature source linewidth can clip a drifting signal. Equal FWHM values also do not imply equal integrated throughput when edge profiles differ.
Optical density (OD) describes attenuation at a specified wavelength: OD6 corresponds to 0.0001% transmission, only within its specified blocking range. Remote leakage where the detector remains sensitive can overwhelm a weak target. Acceptance should therefore verify weighted signal, background across the detector response range, and saturation margin under operating conditions.
 365nm Narrow Bandpass Filter | Ø50mm | T>90%
OT-HBP3659050
365nm Narrow Bandpass Filter; FWHM 10nm; transmission >90%; blocking OD5; size Ø50mm; AOI 0°.
 450nm Narrow Bandpass Filter | Ø50mm
OT-HBP4509050
450nm Narrow Bandpass Filter; FWHM 10nm; transmission >90%; blocking OD5; size Ø50mm; AOI 0°.
 525nm Narrow Bandpass Filter | Ø50mm
OT-HBP5259050
525nm Narrow Bandpass Filter; FWHM 10nm; transmission >90%; blocking OD5; size Ø50mm; AOI 0°.
Send us your drawing and spectral targets — an engineer replies with a feasibility check and quotation within one business day.