Original content by the OOTEE Optics editorial team, drawn from first-hand production line and inspection data. Please credit the source when republishing.
Given limits in expertise and test conditions, the theories, parameters and conclusions here carry no guarantee of absolute accuracy. For technical learning and exchange only - never the sole basis for design, acceptance or selection. Corrections welcome.
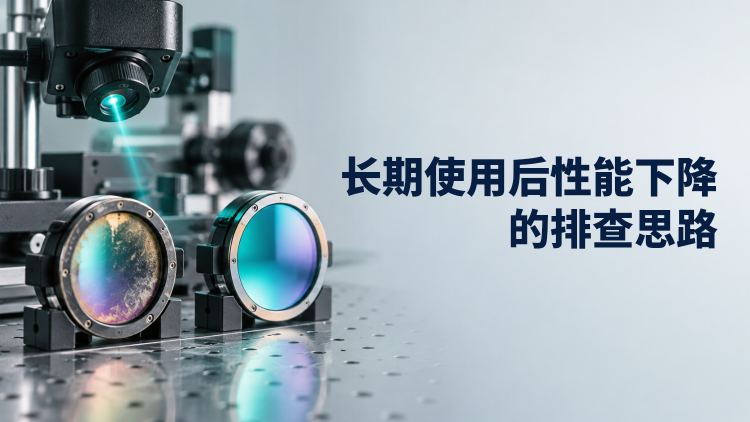
A declining signal over weeks or months is a system symptom. It can originate in the filter, source output, detector response or contamination elsewhere in the optical path. Start by preserving raw readings, dark measurements, operating hours and environmental records.
Check that the sample, exposure, gain and aperture remain comparable. The procedure below addresses gradual drift, with a repeatable baseline as its starting point.
For a linear, unsaturated detector, the dark-subtracted reading can be approximated by:
$$S(t)-D(t)=G\int P(\lambda,t)T_{\mathrm{f}}(\lambda,t)\eta(\lambda,t)R(\lambda,t)\,\mathrm{d}\lambda$$
Here, $G$ is fixed electronic gain, $P$ is incident spectral power density, $T_{\mathrm{f}}$ is filter transmission, $\eta$ represents the remaining optical path and $R$ is detector responsivity. A change in any factor can reduce the reading.
Track center wavelength (CWL), full width at half maximum (FWHM), peak transmission and optical density (OD), with angle of incidence (AOI) documented. For fractional transmission $T$:
$$\mathrm{OD}(\lambda)=-\log_{10}T(\lambda),\qquad \Delta\lambda_{\mathrm{CWL}}=\lambda_{\mathrm{CWL},t}-\lambda_{\mathrm{CWL},0}$$
A filter specified at CWL 780 nm, FWHM 20 nm and OD6 over a defined blocking range needs a full spectral comparison. OD6 means 0.0001% transmission; an instrument with a higher stray-light floor cannot verify that specification.
Measure the removed filter on an independent, verified spectrophotometric system and compare it with the factory trace. Match temperature, AOI, polarization, spot position, aperture and spectral bandwidth. Renew the dark and open-path references. A 0.5 nm sampling interval may help at narrow edges, but does not improve instrument resolution.
Estimate repeatability through rescanning and remounting before interpreting a difference. If factory conditions are missing, establish a reproducible present-day baseline. Exclude angle-induced spectral shifts first. Figure 1 directs filter-specific investigation only when independent testing supports it.
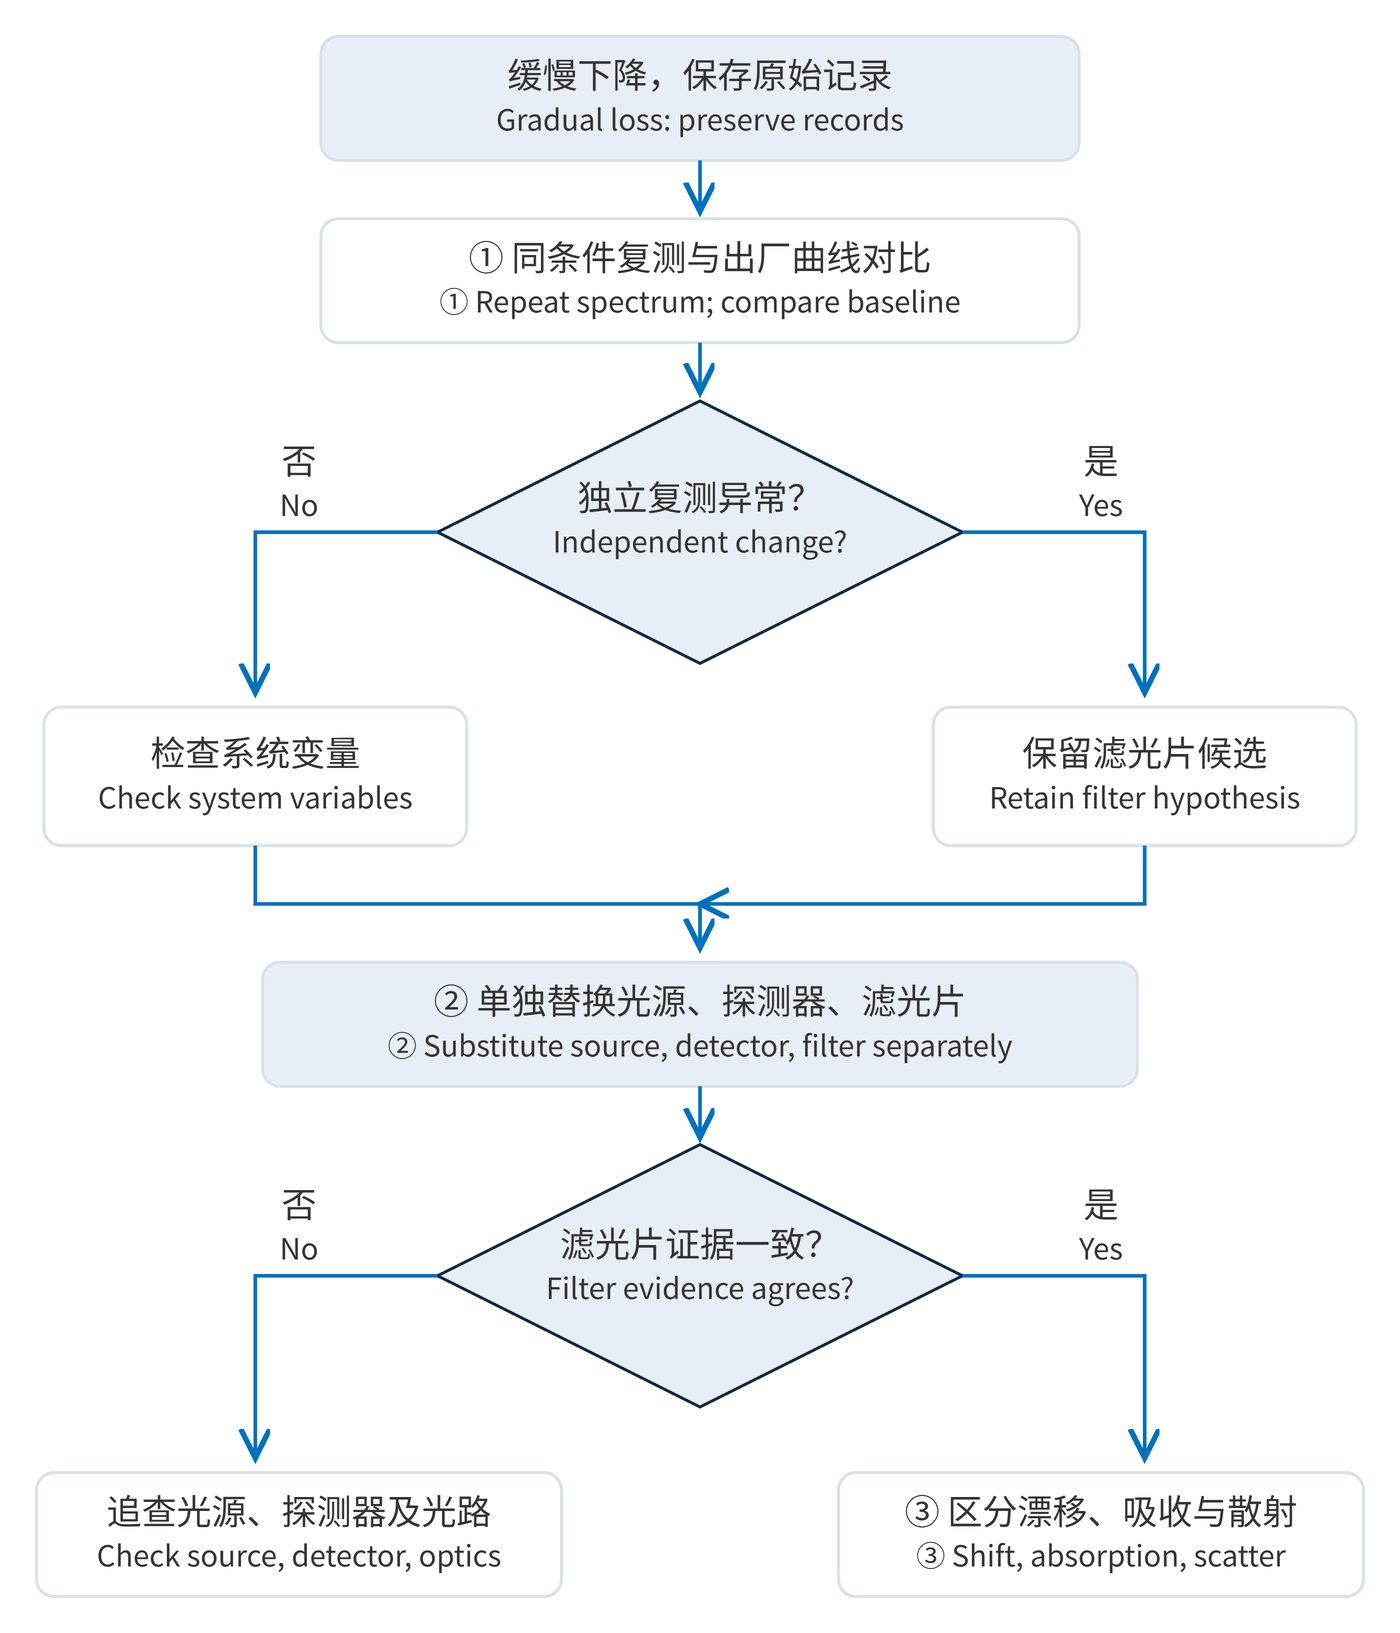
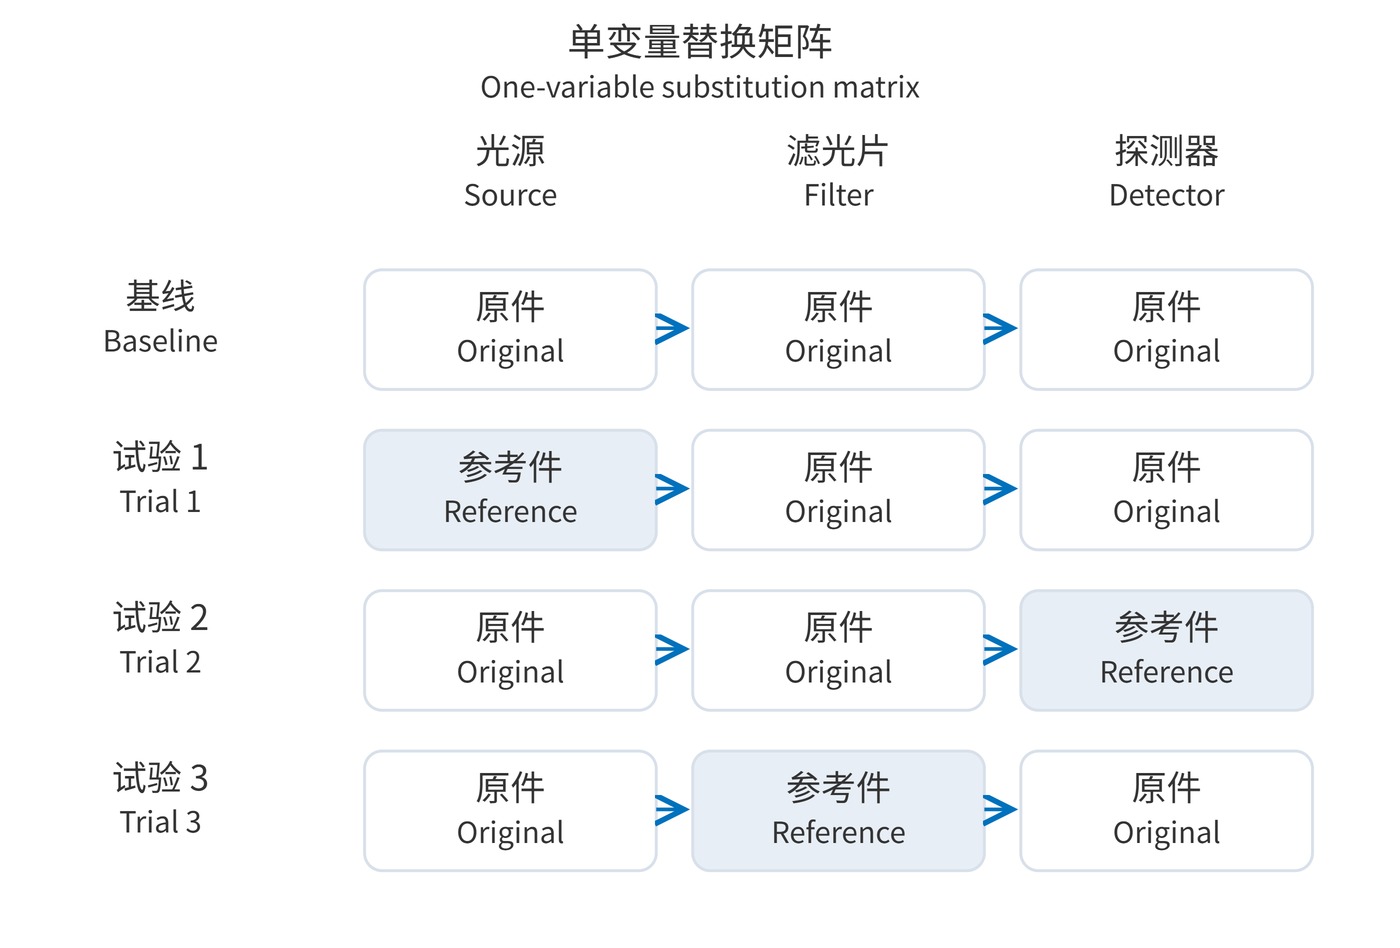
Record the original configuration, then substitute a verified, compatible source, detector and reference filter in separate trials. Restore the original configuration before each new trial. Hold drive settings, gain, alignment and temperature constant; take 3 readings before and after each substitution.
As Figure 2 shows, restoration with another source directs attention to source output and its driver. Restoration with another detector points to responsivity, gain or dark drift. Restoration with a reference filter implicates the filter or its mounting, pending independent spectral confirmation. If none restores performance, inspect windows, lenses, fiber ends and apertures for contamination or coupling changes.
| Candidate | Useful evidence | Interpretation limit |
|---|---|---|
| Humidity-related coating drift | Spectral movement at fixed temperature and AOI, correlated with controlled humidity | Moisture uptake in porous coatings commonly produces a red shift; drying can produce a blue shift. Direction depends on the coating. |
| Adhesive yellowing | A confirmed adhesive layer, preferential short-wavelength loss and increased absorption | Appearance alone cannot distinguish adhesive, substrate and deposits. |
| Surface contamination | Reduced direct transmission with increased scatter; comparable readings before and after approved cleaning | Direct and integrating-sphere total transmission require consistent measurement geometry. |
A study of moisture and temperature effects on coatings reports moisture-induced red shifts and drying-induced blue shifts. A blue shift alone therefore cannot establish moisture uptake.
In fluorescence instruments, use a stable reference sample to separate optical drift from photobleaching. In machine vision, lock exposure and gain and check illumination against a stable reflectance standard. With narrow bandpass filters, reduced overlap with a source line can lower signal even when peak transmission is unchanged. Match CWL, FWHM, AOI and blocking range when selecting a reference.
Normalizing every trace to 100% hides throughput loss. Document the initial surface condition before cleaning, and follow the approved procedure. A single improvement does not establish long-term stability.
One successful substitution also cannot exclude concurrent causes. Reinstall the original configuration to check reproducibility, then report spectral differences, conditions, repeatability and uncertainty. State which variable changed, over which wavelengths and by how much; retain competing explanations where evidence remains incomplete.
 365nm Narrow Bandpass Filter | Ø50mm | T>90%
OT-HBP3659050
365nm Narrow Bandpass Filter; FWHM 10nm; transmission >90%; blocking OD5; size Ø50mm; AOI 0°.
 450nm Narrow Bandpass Filter | Ø50mm
OT-HBP4509050
450nm Narrow Bandpass Filter; FWHM 10nm; transmission >90%; blocking OD5; size Ø50mm; AOI 0°.
 525nm Narrow Bandpass Filter | Ø50mm
OT-HBP5259050
525nm Narrow Bandpass Filter; FWHM 10nm; transmission >90%; blocking OD5; size Ø50mm; AOI 0°.
Send us your drawing and spectral targets — an engineer replies with a feasibility check and quotation within one business day.