Original content by the OOTEE Optics editorial team, drawn from first-hand production line and inspection data. Please credit the source when republishing.
Given limits in expertise and test conditions, the theories, parameters and conclusions here carry no guarantee of absolute accuracy. For technical learning and exchange only - never the sole basis for design, acceptance or selection. Corrections welcome.

A clinical chemistry analyzer measures light transmitted through a reaction mixture. Absorbance is converted into concentration or reaction rate through a validated assay and calibration. The filter defines the measurement spectrum; it does not identify the analyte. Channels commonly fall within 340–800 nm, with each instrument offering a discrete selection.
Typical examples include 340 nm for reduced nicotinamide adenine dinucleotide (NADH) assays and 405 nm for p-nitrophenol reactions. Visible channels such as 505 nm and 546 nm serve other colorimetric chemistries. The reagent method determines the analytical wavelength, reference wavelength and acceptable bandwidth.
Center wavelength (CWL) locates the channel. Full width at half maximum (FWHM) specifies the width at half the peak transmission, while optical density (OD) describes blocking. Angle of incidence (AOI), temperature and beam cone must accompany these specifications because they affect an interference filter's installed response.
For monochromatic light and a homogeneous solution with a stable absorbing species, the Beer–Lambert relation is:
$$A=-\log_{10}\frac{I}{I_0}=\varepsilon(\lambda)lc$$
Here $I_0$ is the blank signal and $I$ the sample signal; $l$ is in $\mathrm{cm}$, $c$ in $\mathrm{mol/L}$, and $\varepsilon$ in $\mathrm{L/(mol\cdot cm)}$. A real channel integrates optical power before taking its logarithm. Variation of absorptivity across the passband can therefore produce a concentration-dependent error.
There is no fixed conversion between bandwidth and cuvette path length. Increasing the path from 5 mm to 10 mm doubles ideal absorbance for the same solution, making the weaker transmitted signal more vulnerable to leakage. It does not establish a requirement to halve FWHM.
If unabsorbed stray light has a ratio $s$ to the desired blank signal and contributes equally to blank and sample readings:
$$A_{\mathrm{meas}}=-\log_{10}\left(\frac{10^{-A}+s}{1+s}\right)$$
At a true absorbance of 3, $s=0.001$ gives approximately 2.699, as shown in Fig. 2. Bandpass blocking reduces unwanted wavelengths, but cannot eliminate same-wavelength bypass light, cuvette scatter or detector nonlinearity. The assumptions behind this model are discussed in a spectrophotometric accuracy reference.
Use narrow bandpass filter specifications as a starting point, then verify the installed beam and assay. These are illustrative engineering targets, not universal acceptance limits or product specifications.
| Item | Example target | Verification needed |
|---|---|---|
| 340 nm channel | CWL 340 nm ±1 nm; FWHM 10 nm ±2 nm | Test at nominal AOI 0° with the working beam cone; check UV transmission of substrate and cuvette |
| Transmission and blocking | Peak ≥70%; OD ≥4 across an example stopband of 380–1100 nm | Also specify short-wave blocking, transition regions and leaks across the source–detector overlap |
| Installed geometry | Clear aperture ≥4 mm; nominal path 5 mm | Check beam footprint, wheel indexing, orientation and cuvette path variation |
OD4 means a transmission ratio of $10^{-4}$ at a given wavelength. Total leakage depends on the source spectrum and detector response integrated over the stopband. Long-wavelength leakage deserves particular attention when the useful 340 nm signal is weak. Acceptance requires spectral scans, dark-signal checks and an absorbance series. Record the illuminated aperture and beam cone during testing: a normal-incidence scan with a small collimated beam may miss the response seen by a converging instrument beam. Keep the source and detector weighting consistent when comparing candidate filters.
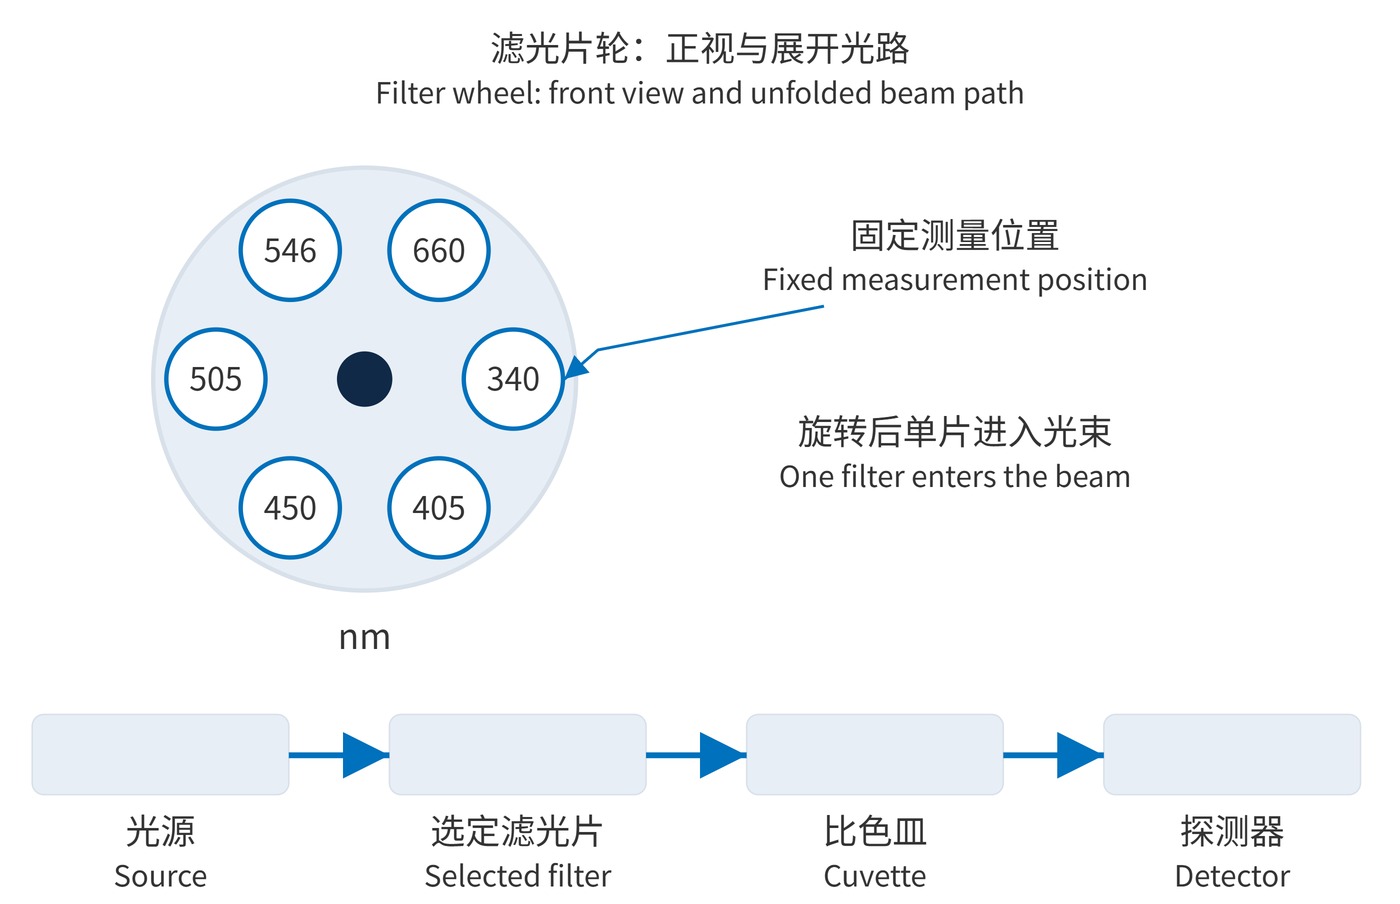
In Fig. 1, a wheel places one filter at a time in a fixed beam before the cuvette. This supports fixed assay menus with relatively simple detection electronics. Switching time, wear and indexing repeatability are the main trade-offs. Sequential dual-wavelength readings also need timing checks for rapidly changing reactions.
Post-sample dispersion sends broadband light through the reaction mixture before a grating separates it onto multiple detector channels. This enables readings at several wavelengths at the same sampling instant; a chemistry analyzer optical-path description documents this arrangement. Slits, dispersion, aberrations and detector dimensions set the effective bandwidth. Order overlap, channel crosstalk and stray light still require control, including order-sorting filters where needed.
A wheel trades mechanical switching for simpler detection. A static grating reduces wavelength-selection motion but demands careful spectral alignment and channel calibration. Assay wavelengths, synchronization and maintenance requirements determine the better fit. For kinetic assays, evaluate the actual interval between readings rather than the nominal wheel speed alone. For a detector array, verify that electronic readout timing preserves the required correspondence between channels.
Reducing FWHM from 10 nm to 5 nm may improve spectral selectivity while sacrificing photon signal and precision. A reference wavelength corrects only the backgrounds addressed by the validated method; it does not remove every sample interference.
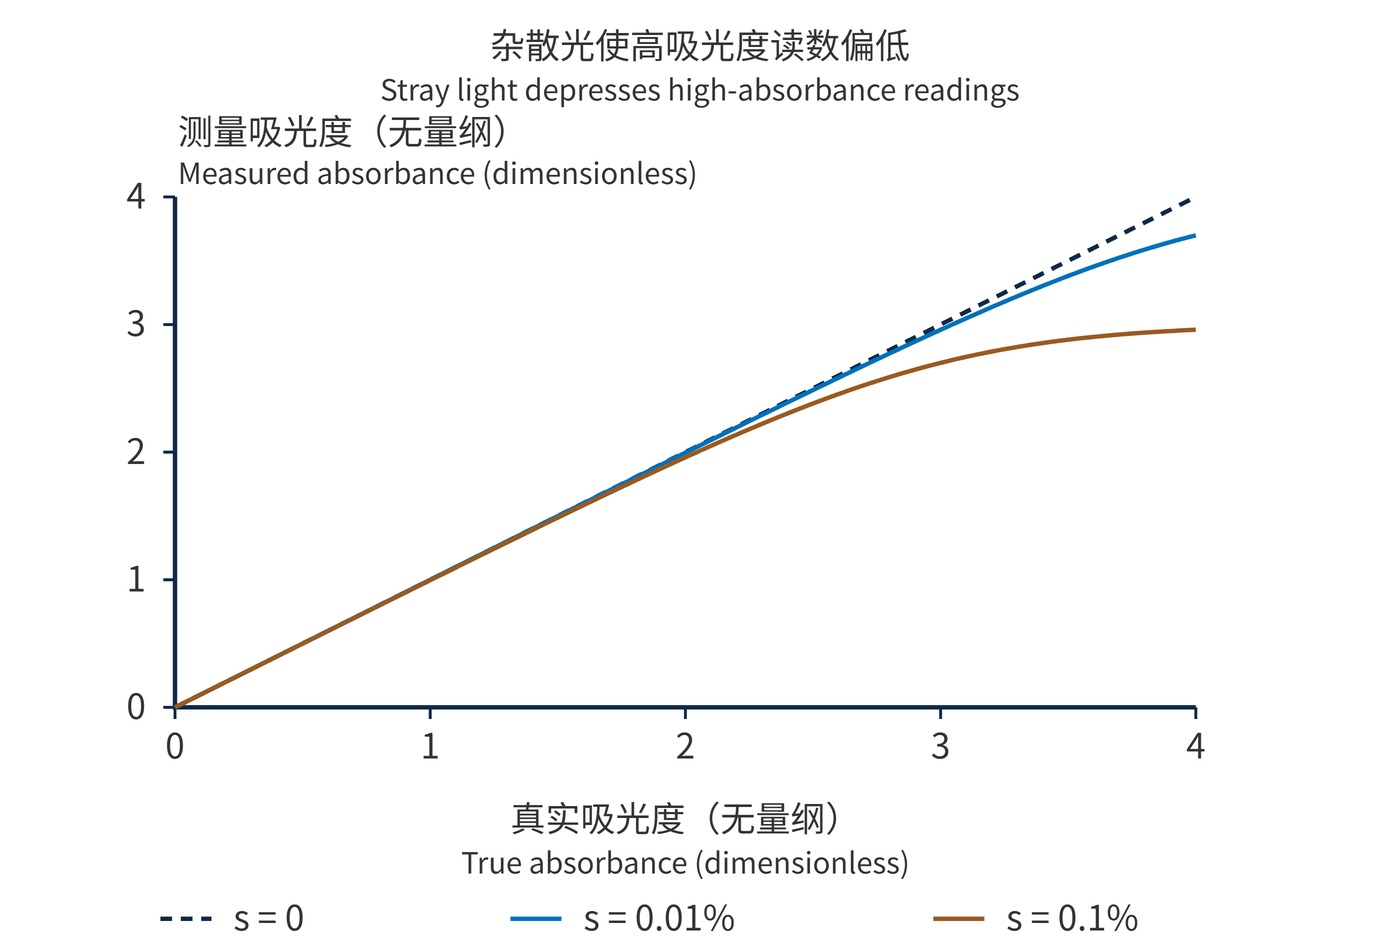
Fig. 2 is a point-by-point calculation, not instrument data. Neither a filter OD value nor a successful blank adjustment establishes the analyzer's linear range. Verify bias and repeatability with standards spanning the intended range at the specified temperature, optical path and sampling sequence.
 365nm Narrow Bandpass Filter | Ø50mm | T>90%
OT-HBP3659050
365nm Narrow Bandpass Filter; FWHM 10nm; transmission >90%; blocking OD5; size Ø50mm; AOI 0°.
 450nm Narrow Bandpass Filter | Ø50mm
OT-HBP4509050
450nm Narrow Bandpass Filter; FWHM 10nm; transmission >90%; blocking OD5; size Ø50mm; AOI 0°.
 525nm Narrow Bandpass Filter | Ø50mm
OT-HBP5259050
525nm Narrow Bandpass Filter; FWHM 10nm; transmission >90%; blocking OD5; size Ø50mm; AOI 0°.
Send us your drawing and spectral targets — an engineer replies with a feasibility check and quotation within one business day.