Original content by the OOTEE Optics editorial team, drawn from first-hand production line and inspection data. Please credit the source when republishing.
Given limits in expertise and test conditions, the theories, parameters and conclusions here carry no guarantee of absolute accuracy. For technical learning and exchange only - never the sole basis for design, acceptance or selection. Corrections welcome.

A narrowband filter selects a small spectral interval from reflected sunlight or atmospheric radiation. It provides a measurement channel, not a direct reading of chlorophyll or pollutant concentration. Quantitative monitoring still requires radiometric calibration, atmospheric correction and a retrieval model.
Vegetation absorbs strongly in the red and reflects much more in the near infrared. The transition, called the red edge, carries different information from either the absorption trough or the near-infrared plateau. The ESA mission description identifies vegetation channels near 705 nm, 740 nm, 783 nm and 865 nm. Their placement matters as much as their width.
Multilayer dielectric interference creates the passband. Center wavelength (CWL) locates it; full width at half maximum (FWHM) measures its width at half the peak transmission. Optical density (OD) specifies rejection over a stated blocking interval. Angle of incidence (AOI) must describe the operating beam.
The channel signal is approximately:
$$D=K\int L(\lambda)T_f(\lambda)S_d(\lambda)\,\mathrm{d}\lambda$$
Here $L$ is entrance-pupil spectral radiance, $T_f$ is filter transmission, $S_d$ includes detector and remaining optical response, and $K$ includes geometry and exposure. Two filters with identical CWL and FWHM can therefore produce different signals.
As Fig. 1 shows, 705 nm samples the rising edge while 865 nm samples the plateau. The normalized difference red-edge index (NDRE) is commonly expressed as $(\rho_{\mathrm{NIR}}-\rho_{\mathrm{RE}})/(\rho_{\mathrm{NIR}}+\rho_{\mathrm{RE}})$. These reflectances should be corrected, band-equivalent measurements rather than point samples at the nominal centers.
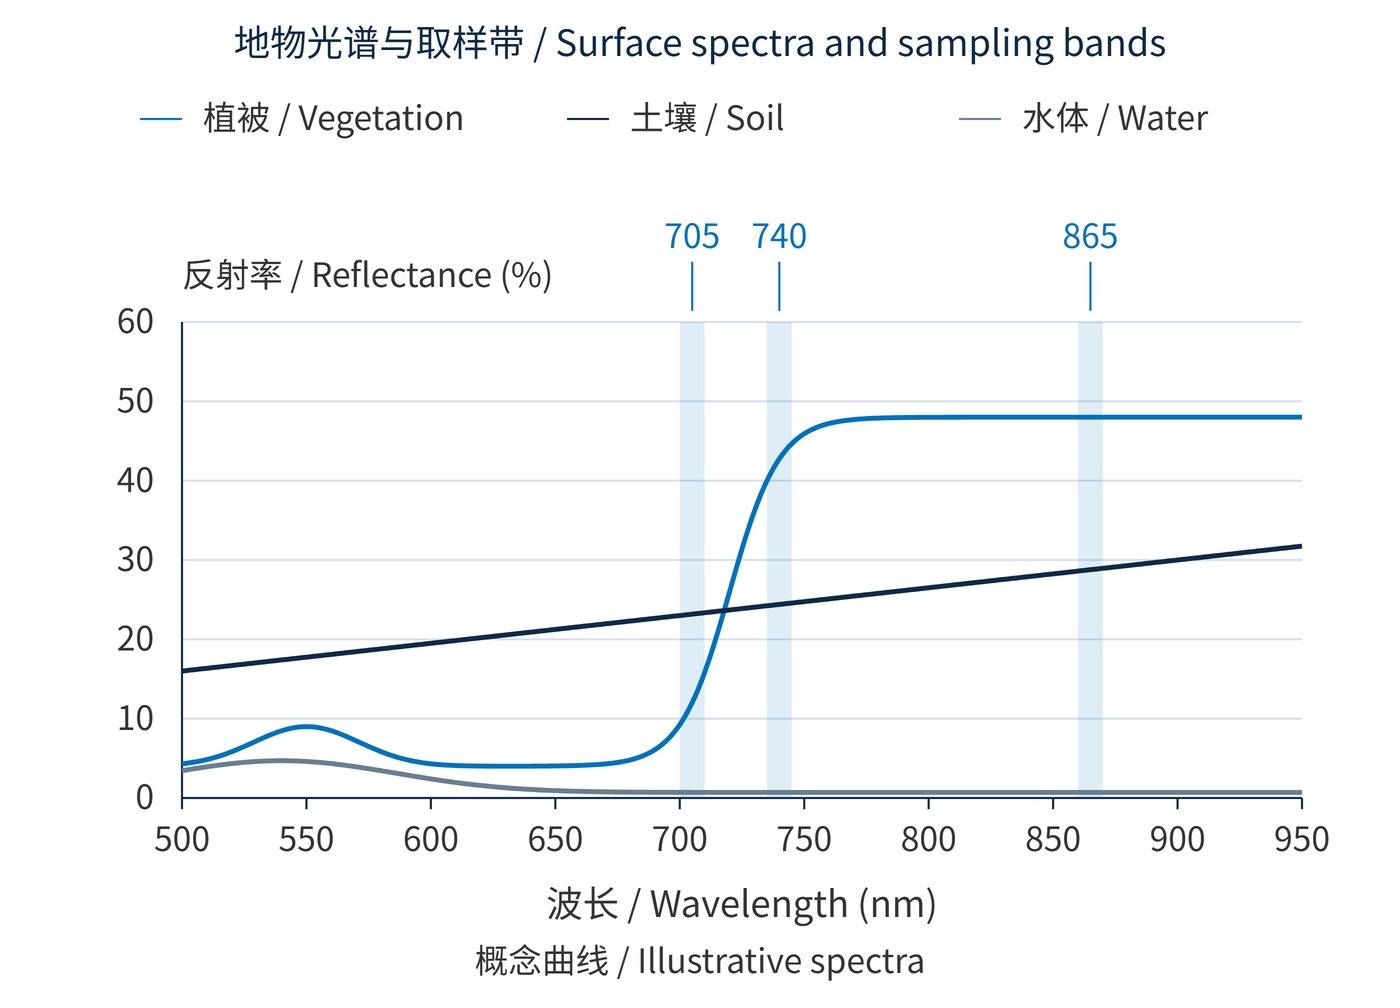
Fig. 1 uses analytical illustrative spectra evaluated at 1 nm intervals, not measured data. Shading marks nominal 10 nm FWHM intervals centered at 705 nm, 740 nm and 865 nm; it does not describe actual filter edges or a particular sensor.
Start with the target feature and reference channel, then convolve surface spectra with illumination, atmospheric transmission and instrument response. Surface imaging generally uses relatively transparent visible, near-infrared or shortwave-infrared windows. Water-vapor absorption near 940 nm changes the received signal. For water-vapor retrieval, that absorption becomes useful when compared with adjacent reference channels, as explained in NASA's algorithm overview.
A narrow bandpass filter specification might start at CWL 705 nm, FWHM 10 nm, peak transmission at least 85%, and OD4 over 450–680 nm and 730–1000 nm. This is a discussion example, not a product guarantee. Transition regions and leakage across the detector's full sensitivity range need separate assessment.
An effective-index approximation combines angular shift with a measured thermal coefficient:
$$\lambda_c(\theta,\tau)\approx[\lambda_0+k_\tau(\tau-\tau_0)]\sqrt{1-\frac{\sin^2\theta}{n_{\mathrm{eff}}^2}}$$
This small-angle estimate assumes incidence from air. It does not replace a coating model or predict polarization splitting and broadening in a converging beam. With $\lambda_0=705\,\mathrm{nm}$ and $n_{\mathrm{eff}}=1.8$, increasing AOI from 0° to 10° gives about 3.29 nm of blue shift. An assumed thermal coefficient of $0.015\,\mathrm{nm/^{\circ}C}$ gives 0.60 nm of red shift over a 40 °C rise. Nominal cancellation is not a stability strategy.
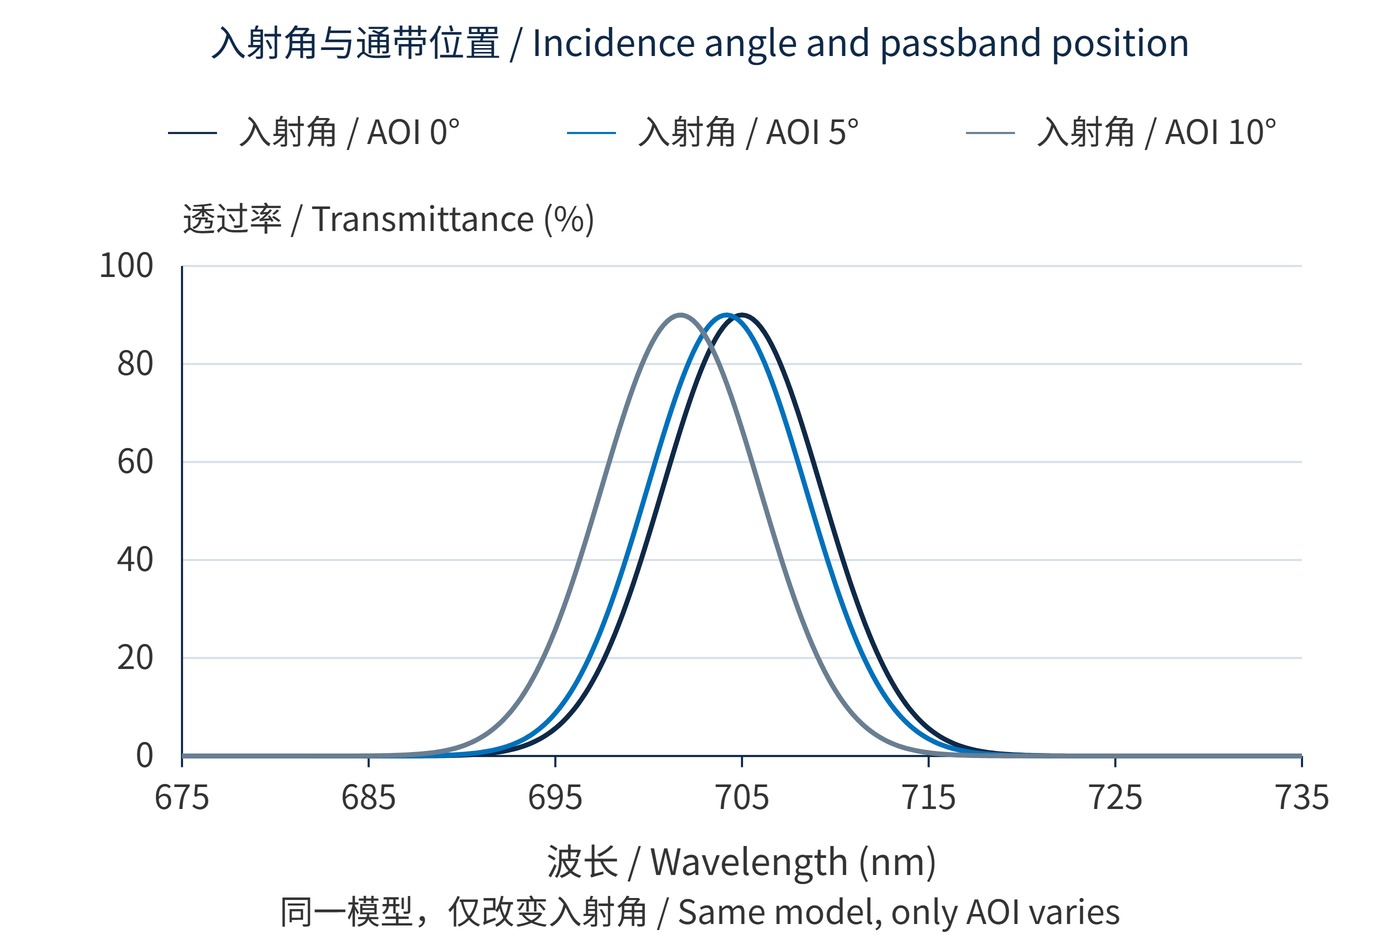
Fig. 2 holds temperature, 90% peak transmission, 10 nm FWHM and effective index 1.8 constant. Gaussian passbands are calculated at 0.2 nm intervals using the angular model; only AOI changes. On a steep red edge, such displacement can mimic a chlorophyll change. Measured responses across temperature and field angle belong in the retrieval uncertainty budget.
| Task | Initial bandwidth study | Validation priorities |
|---|---|---|
| Airborne vegetation mapping | Explore 5–15 nm red-edge channels | Attitude, lens cone, exposure and changing irradiance |
| Spaceborne multispectral monitoring | Explore 10–30 nm against photon budget | Orbital thermal states, long-term response and channel consistency |
| Ground-based water-vapor sensing | Optimize absorption and reference channels together | Path length, humidity range and absorption saturation |
These are starting ranges, not platform standards. Spaceborne imaging may need broader channels to retain signal-to-noise ratio under aperture, exposure and ground-resolution constraints; dedicated orbital spectroscopy can demand much narrower bands. Airborne systems can adjust flight altitude and exposure, yet fast acquisition or weak signals can also favor broader channels.
Narrower bands do not automatically improve retrieval accuracy: photon loss may make noise dominant. Matching CWL does not ensure equivalent channels, because asymmetry, leakage and field-angle distributions alter spectral weighting. Nor is a vegetation index a universal chlorophyll conversion; canopy structure, soil background and viewing geometry remain relevant.
Acceptance should retain system spectral responses indexed by temperature, AOI, polarization and aperture position. Recalculate index bias using a common set of surface and atmospheric scenarios. Nominal bands become comparable only when the resulting bias and calibration uncertainty fit the retrieval budget.
 365nm Narrow Bandpass Filter | Ø50mm | T>90%
OT-HBP3659050
365nm Narrow Bandpass Filter; FWHM 10nm; transmission >90%; blocking OD5; size Ø50mm; AOI 0°.
 450nm Narrow Bandpass Filter | Ø50mm
OT-HBP4509050
450nm Narrow Bandpass Filter; FWHM 10nm; transmission >90%; blocking OD5; size Ø50mm; AOI 0°.
 525nm Narrow Bandpass Filter | Ø50mm
OT-HBP5259050
525nm Narrow Bandpass Filter; FWHM 10nm; transmission >90%; blocking OD5; size Ø50mm; AOI 0°.
Send us your drawing and spectral targets — an engineer replies with a feasibility check and quotation within one business day.