Original content by the OOTEE Optics editorial team, drawn from first-hand production line and inspection data. Please credit the source when republishing.
Given limits in expertise and test conditions, the theories, parameters and conclusions here carry no guarantee of absolute accuracy. For technical learning and exchange only - never the sole basis for design, acceptance or selection. Corrections welcome.
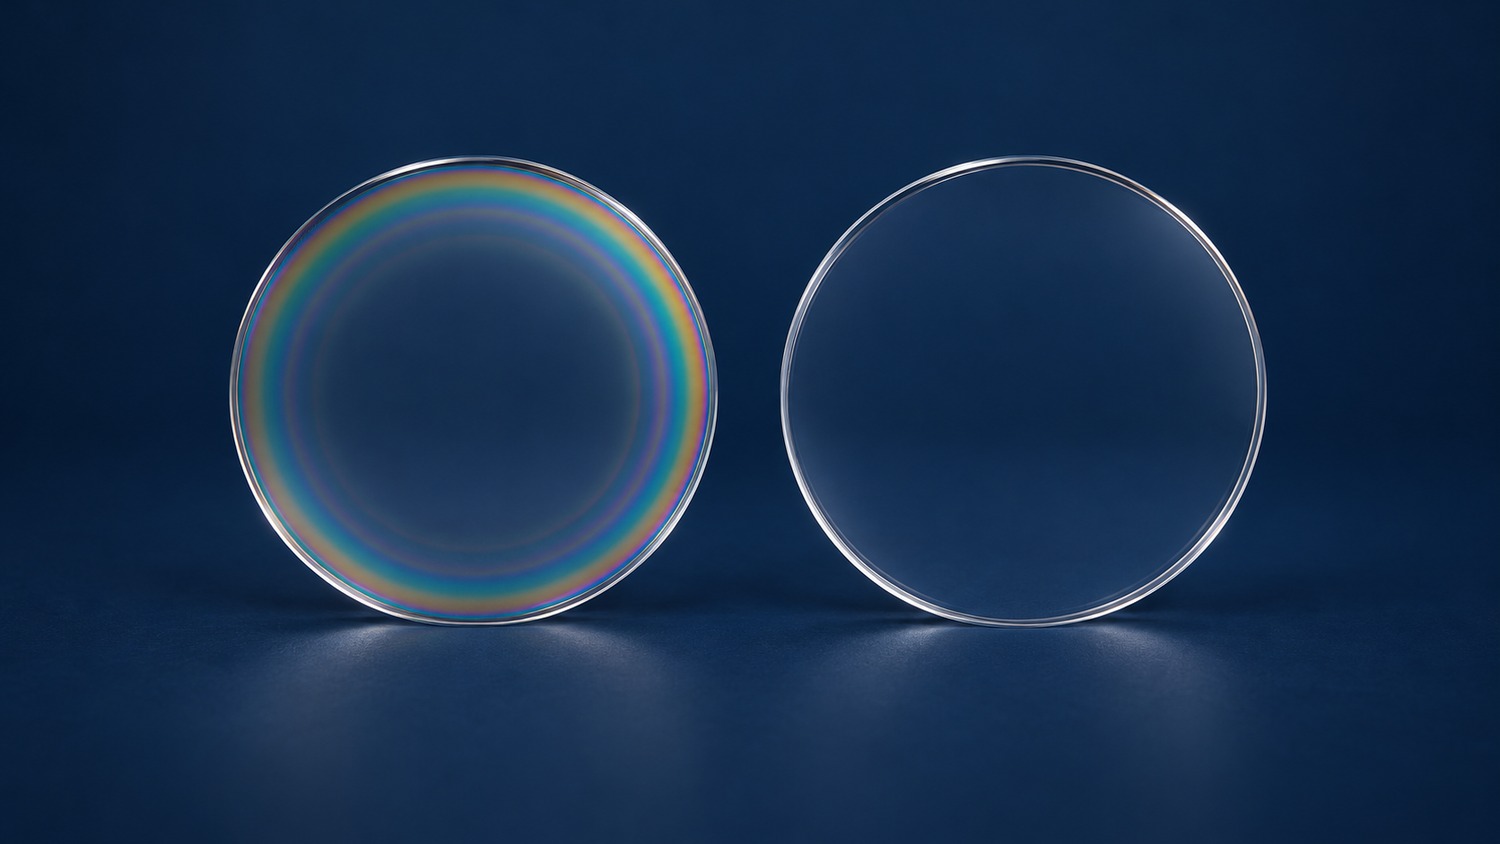
Coating uniformity describes how film properties and spectral performance vary across one substrate. A passing center measurement does not qualify the edge. This is a spatial property of one part, distinct from consistency between parts in a production batch.
Track center wavelength (CWL), full width at half maximum (FWHM), optical density (OD), and angle of incidence (AOI) at defined locations. Thickness uniformity and spectral uniformity are related, but they need separate definitions. Visible color rings can suggest a gradient; they cannot establish near-infrared transmission or deep blocking.
Source distance, deposition direction, and shadowing affect the material arriving at each location. An edge can be thinner or thicker than the center. Rotation and correction masks help compensate the flux distribution, but do not ensure identical deposition in every layer. Research published in Applied Optics on planetary rotation and uniformity correction describes the underlying deposition problem.
Fig. 1 isolates proportional layer scaling. At a fixed AOI, with negligible dispersion and unchanged refractive index $n$, a small common thickness change gives:
$$\frac{\Delta\lambda}{\lambda_0}\approx\frac{\Delta(nd)}{n_0d_0}\approx\frac{\Delta d}{d_0}$$
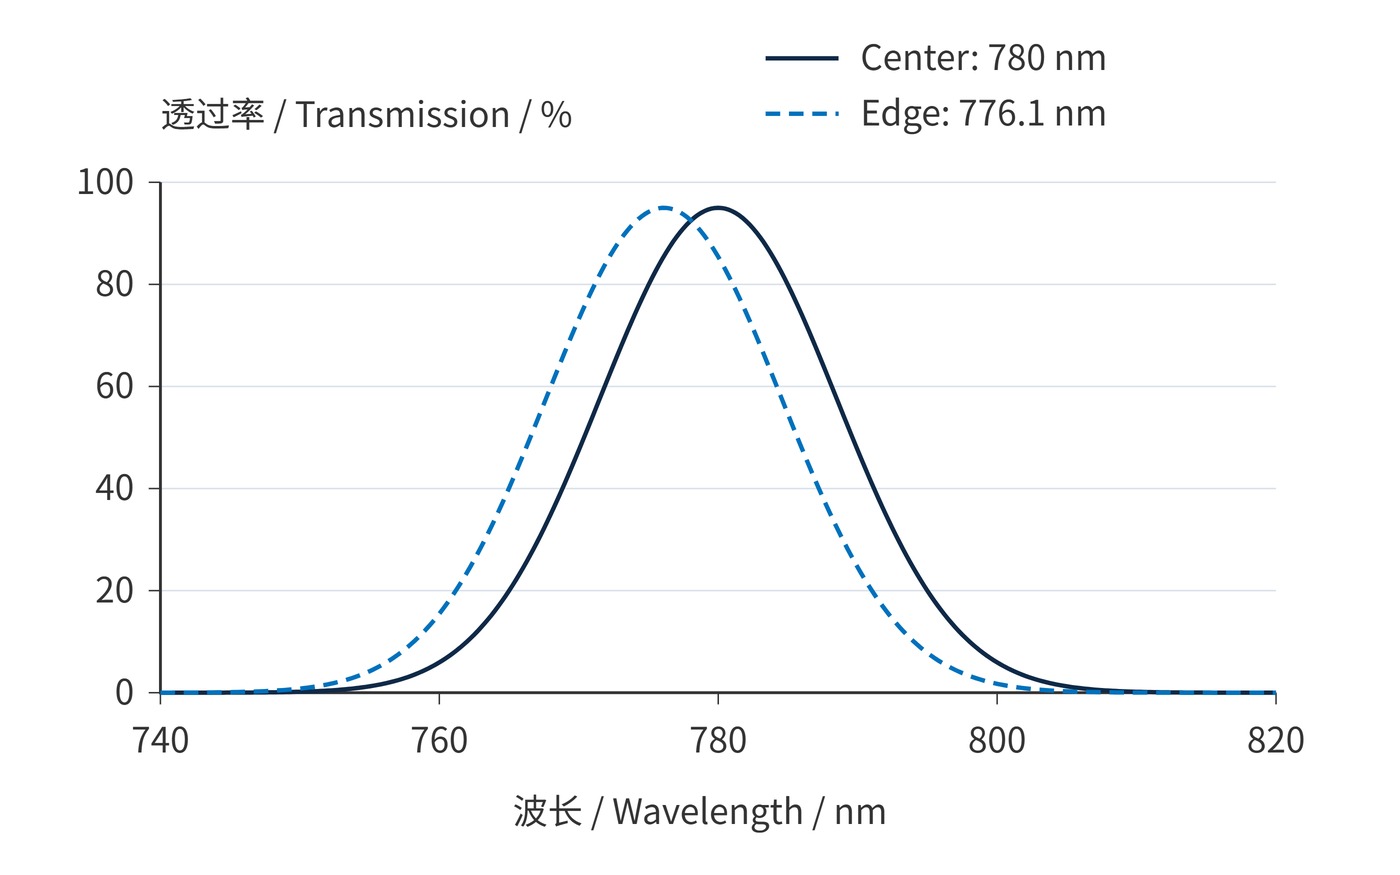
For a 780 nm bandpass with a 20 nm FWHM, a 0.5% thickness reduction predicts roughly a 3.9 nm blue shift. Unequal errors between layers, or index changes associated with film density, can also alter bandwidth, peak transmission, and blocking. A simple wavelength translation is then insufficient.
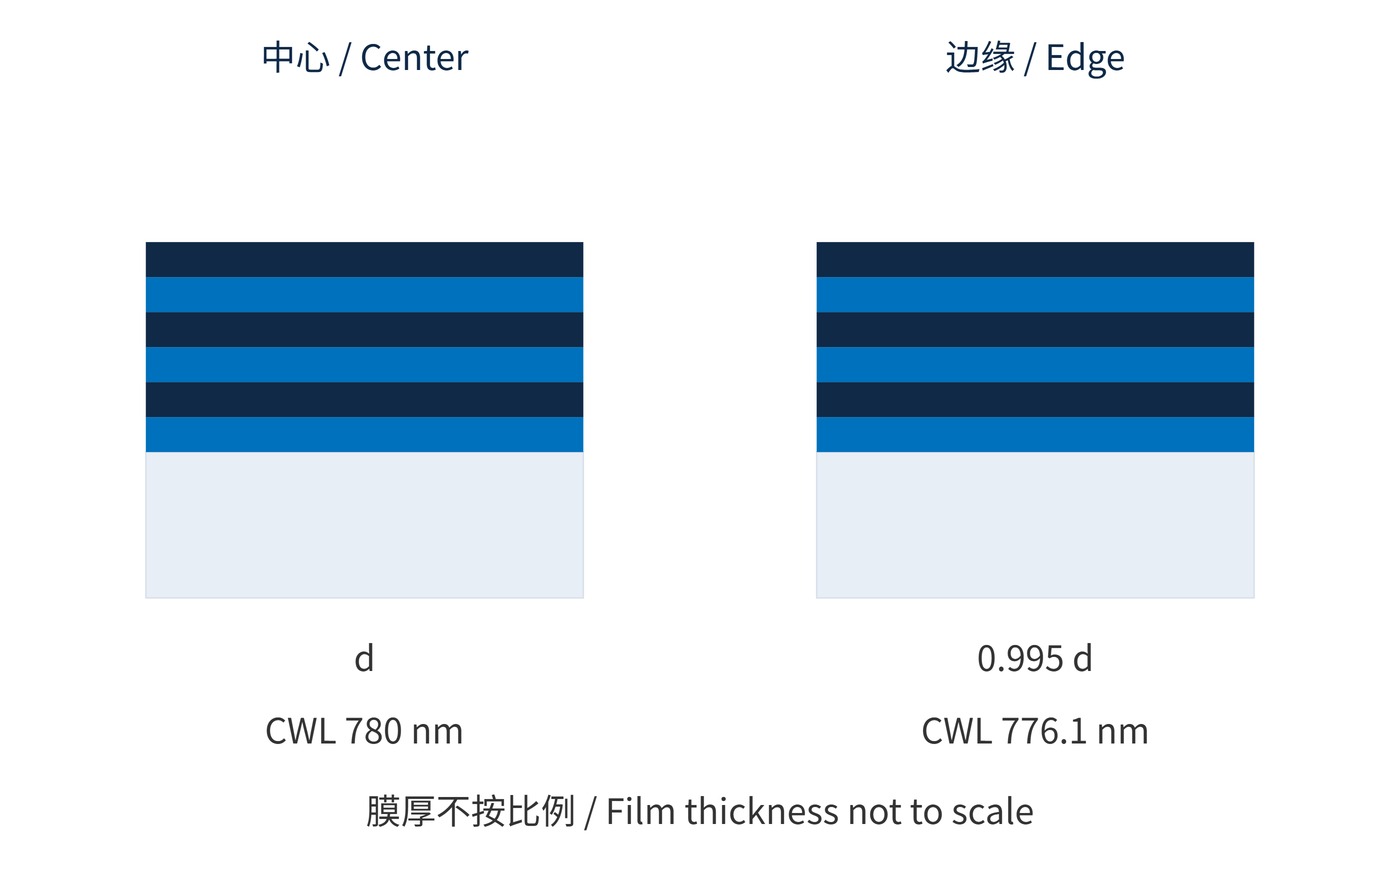
Fig. 2 shows why equal peak transmission does not guarantee equal throughput at a fixed 780 nm signal. Its analytic model changes only the thickness scale. It is neither a multilayer design calculation nor evidence of OD6 blocking.
One useful spatial metric is the sampled peak-to-valley CWL range, normalized to the center measurement $\lambda_{\mathrm{c}}$:
$$U_{\lambda}=\frac{\lambda_{\max}-\lambda_{\min}}{\lambda_{\mathrm{c}}}\times100\%$$
A center value of 780 nm and sampled limits of 776.1–780 nm give 0.5%. This is a full range, not ±0.5%. Absolute deviation from the nominal wavelength must also be specified: a uniformly misplaced passband can have excellent spatial uniformity.
Start with the area illuminated in service. The following is an illustrative acceptance specification, not a product claim. Every sampled point must meet the absolute limits as well as the spatial range requirement.
| Item | Example agreement |
|---|---|
| Area and sampling | 50 mm substrate; 44 mm inspection diameter; center plus 4 points each at radii 10 and 20 mm |
| Test conditions | AOI 0°; 23 ± 2 °C; 1 mm spot diameter; record spectral resolution and angular spread |
| Passband | At every point: CWL 780 ± 2 nm; FWHM 20 ± 2 nm; peak transmission ≥90% |
| Spatial range and blocking | CWL peak-to-valley ≤2 nm; OD6 at every point over 400–740 nm and 820–1000 nm |
Sample both radius and azimuth, as in Fig. 3. A single diameter can miss a directional defect. Nine points provide screening, not proof of continuous compliance between locations. Increase mapping density for narrow passbands, large apertures, or moving beams. Keep the spot entirely inside the inspection area and retain coordinates, part orientation, and raw spectra.
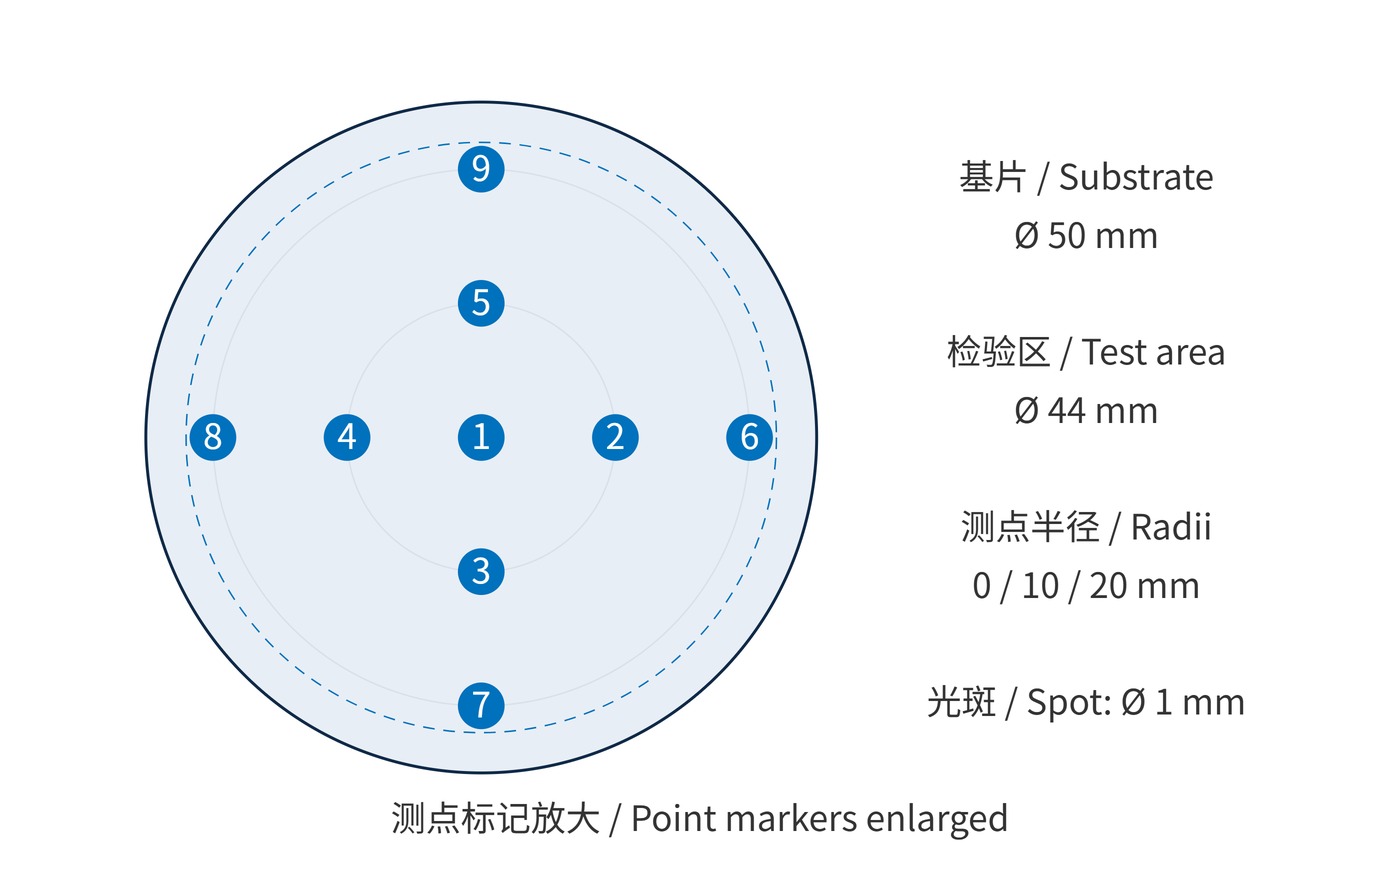
A large measurement spot averages local spectra and can hide extremes while broadening the measured band. Use the same spot size, AOI, polarization, and instrument settings throughout a map. OD6 means a transmission fraction of $10^{-6}$; reports must state stray-light limitations, dynamic range, and the measurement floor. A detector floor is not a verified blocking value.
Spatial spectral variation can produce field-dependent brightness in fluorescence imaging. Illumination nonuniformity, vignetting, and detector response remain alternative causes. In scanning instruments, a moving beam converts a spatial coating gradient into signal variation. Large-aperture receivers need acceptable signal transmission and background rejection at the worst illuminated location.
Field-edge rays may also arrive obliquely. First map the coating at a common AOI, then verify it in the actual illumination cone. This separates coating variation from shifts introduced by the system geometry.
A useful acceptance record contains coordinate-linked spectra, parameter extrema, and test conditions. These connect the center measurement to edge behavior and to the area the system actually uses.
 365nm Narrow Bandpass Filter | Ø50mm | T>90%
OT-HBP3659050
365nm Narrow Bandpass Filter; FWHM 10nm; transmission >90%; blocking OD5; size Ø50mm; AOI 0°.
 450nm Narrow Bandpass Filter | Ø50mm
OT-HBP4509050
450nm Narrow Bandpass Filter; FWHM 10nm; transmission >90%; blocking OD5; size Ø50mm; AOI 0°.
 525nm Narrow Bandpass Filter | Ø50mm
OT-HBP5259050
525nm Narrow Bandpass Filter; FWHM 10nm; transmission >90%; blocking OD5; size Ø50mm; AOI 0°.
Send us your drawing and spectral targets — an engineer replies with a feasibility check and quotation within one business day.