Original content by the OOTEE Optics editorial team, drawn from first-hand production line and inspection data. Please credit the source when republishing.
Given limits in expertise and test conditions, the theories, parameters and conclusions here carry no guarantee of absolute accuracy. For technical learning and exchange only - never the sole basis for design, acceptance or selection. Corrections welcome.

Yield control reduces losses created within one coating run: position-dependent deposition, process excursions and damage during later operations. A satisfactory average spectrum does not establish that every loaded position has a usable process margin.
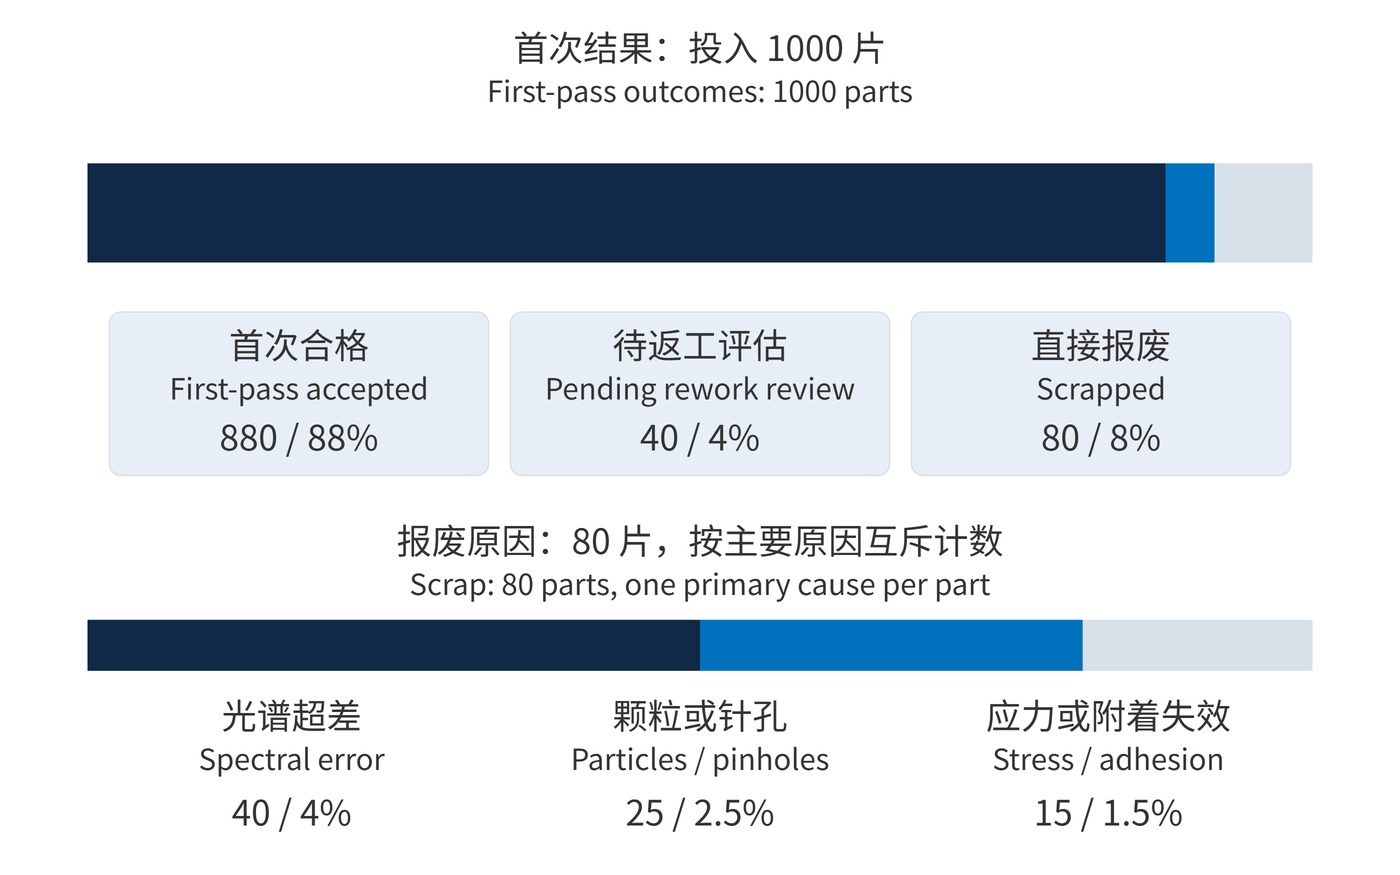
First-pass yield counts parts that complete the defined route without rework. Keep the input denominator fixed and register witness and development pieces separately. The following 1000-part example is illustrative, not factory performance data.
$$Y_{\mathrm{FP}}=\frac{N_{\mathrm{first\ pass}}}{N_{\mathrm{input}}}\times100\%$$
Fig. 1 separates 880 first-pass parts, 40 awaiting rework assessment and 80 scrapped parts. First-pass yield is 88%. If rework subsequently returns 30 parts to conformity, cumulative yield becomes 91%. Reporting both values preserves visibility of the additional manufacturing burden.
Consider a teaching specification with center wavelength (CWL) 780±1 nm, full width at half maximum (FWHM) 20 nm, peak transmission at least 90% and optical density (OD) at least 6 throughout a specified 400–700 nm blocking interval. Compare results at an angle of incidence (AOI) of 0°, 23±2 °C and the same defined clear aperture.
Retain carrier coordinates for center, middle and outer positions. A common wavelength offset suggests a shared optical-thickness or endpoint error; separation between position groups points toward tooling, masking, rotation or deposition geometry. The physics of coating thickness control helps identify causes, but the carrier average alone cannot identify the correct adjustment.
The synthetic data in Fig. 2 average exactly 780 nm yet include out-of-specification tails. Spatial groups are not time subgroups. Pooling distinct position populations into one normal distribution can conceal local losses.
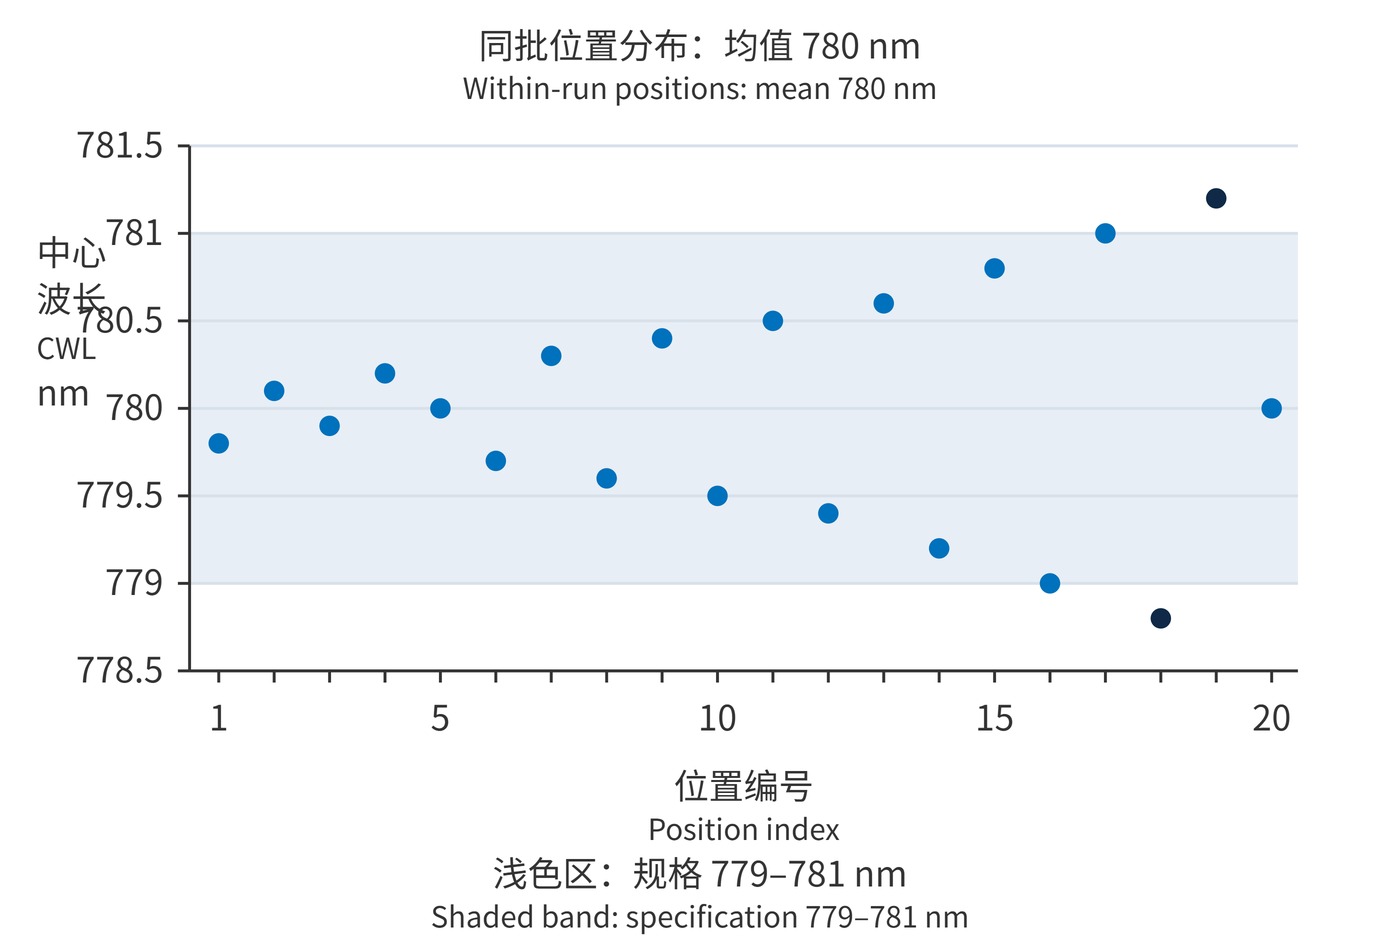
For a stable process, capability relates the available specification margin to within-subgroup variation:
$$C_{\mathrm{pk}}=\min\left(\frac{\mathrm{USL}-\mu}{3\sigma_{\mathrm{within}}},\frac{\mu-\mathrm{LSL}}{3\sigma_{\mathrm{within}}}\right)$$
USL and LSL denote specification limits. A mean of 780.2 nm and a justified within-subgroup standard deviation of 0.2 nm give 1.33. This requires stability, appropriate grouping and adequate measurement performance; one spatial sample cannot predict long-term yield. NIST's capability guidance explains the stability prerequisite.
Statistical process control (SPC) should track variables that support intervention. Establish measurement repeatability and witness-to-part correlation before setting position-specific baselines. Control limits describe stable process behavior; specification limits describe functional requirements.
| Process stage | Recorded variables | Response to an excursion |
|---|---|---|
| Loading and heating | Position, substrate temperature, vacuum stabilization time | Hold deposition until the process window is met |
| Deposition | Rate, endpoint residual, oxygen partial pressure | Pause or terminate under predefined rules; preserve layer records |
| Cooling and unloading | Witness CWL, spatial differences, stress indications | Contain affected positions and correlate process logs |
| Cutting and transfer | New chips, scratches and usable-area loss | Separate machining losses from coating losses |
Fixed time windows can form rational subgroups for rate mean-and-range charts. Individual endpoint residuals may suit individuals and moving-range charts. Strongly autocorrelated samples require suitable treatment. Investigate predefined alarms and verify corrective action; shifting limits to silence an alarm does not correct the process.
Choose subgroup boundaries before interpreting the results. A subgroup should represent comparable operating conditions, rather than mixing warm-up, steady deposition and an intentional recipe change. Record the affected time interval and layer numbers when an excursion occurs. These records connect an alarm to the parts at risk and make the containment decision reproducible.
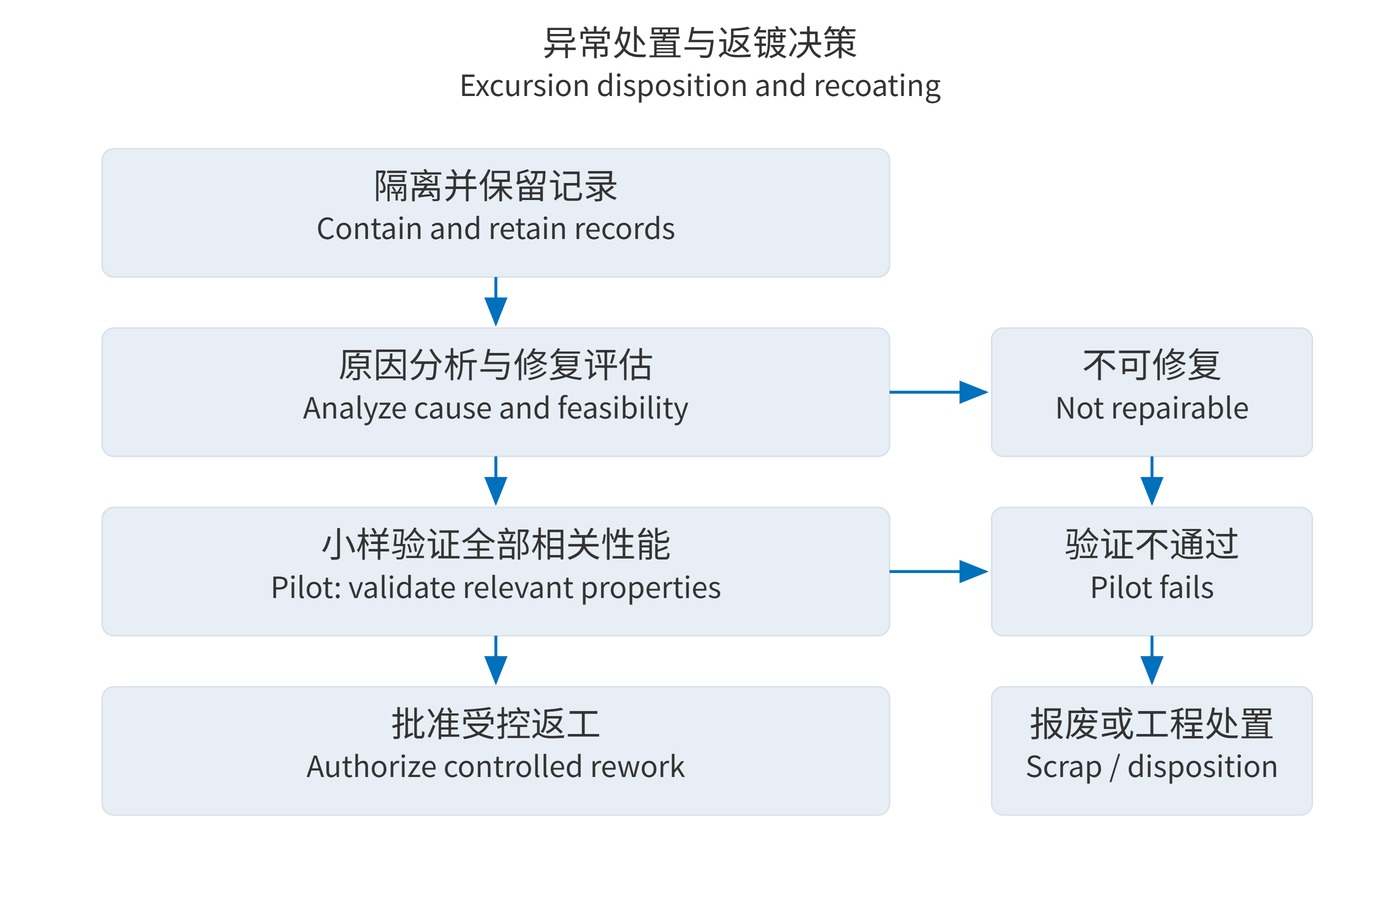
Fig. 3 makes rework conditional on failure analysis. Distinguish validated stripping and recoating, a demonstrated corrective layer design, and irreversible damage. A CWL offset alone does not establish that an extra layer will restore the passband. Check substrate condition, figure and stripping compatibility before a pilot trial.
The pilot must address the properties that rework could change, including blocking, bandwidth, stress and adhesion. Its acceptance criteria should be defined before processing. A technically repairable part may still be unsuitable for rework if the remaining schedule, expected rework success rate and accumulated processing exposure make the route impractical. Keep that decision separate from the original failure classification.
Position-dependent CWL errors can dominate losses for narrow bandpass filters; pinholes and blocking leakage may dominate in weak-signal applications. Assign one primary loss category per part while retaining secondary defect tags.
Fig. 1 divides 80 scrapped parts into 40 spectral failures, 25 particle or pinhole failures and 15 stress or adhesion failures. Combine this ranking with affected area, correction cost and recurrence risk. The 40 pending parts remain outside both accepted and scrap totals until disposition.
Final yield alone hides first-pass loss. Average CWL hides spatial tails. Assigning every defect to deposition hides downstream damage. Preserve each reworked part's position, failure code, stripping count and thermal history.
A restored spectrum does not establish restored adhesion or durability. Improvement is demonstrated when a corrective action reduces the original failure mechanism without introducing a new reliability risk, with first-pass results and dispositions traceable to the same manufacturing records.
 365nm Narrow Bandpass Filter | Ø50mm | T>90%
OT-HBP3659050
365nm Narrow Bandpass Filter; FWHM 10nm; transmission >90%; blocking OD5; size Ø50mm; AOI 0°.
 450nm Narrow Bandpass Filter | Ø50mm
OT-HBP4509050
450nm Narrow Bandpass Filter; FWHM 10nm; transmission >90%; blocking OD5; size Ø50mm; AOI 0°.
 525nm Narrow Bandpass Filter | Ø50mm
OT-HBP5259050
525nm Narrow Bandpass Filter; FWHM 10nm; transmission >90%; blocking OD5; size Ø50mm; AOI 0°.
Send us your drawing and spectral targets — an engineer replies with a feasibility check and quotation within one business day.