Original content by the OOTEE Optics editorial team, drawn from first-hand production line and inspection data. Please credit the source when republishing.
Given limits in expertise and test conditions, the theories, parameters and conclusions here carry no guarantee of absolute accuracy. For technical learning and exchange only - never the sole basis for design, acceptance or selection. Corrections welcome.
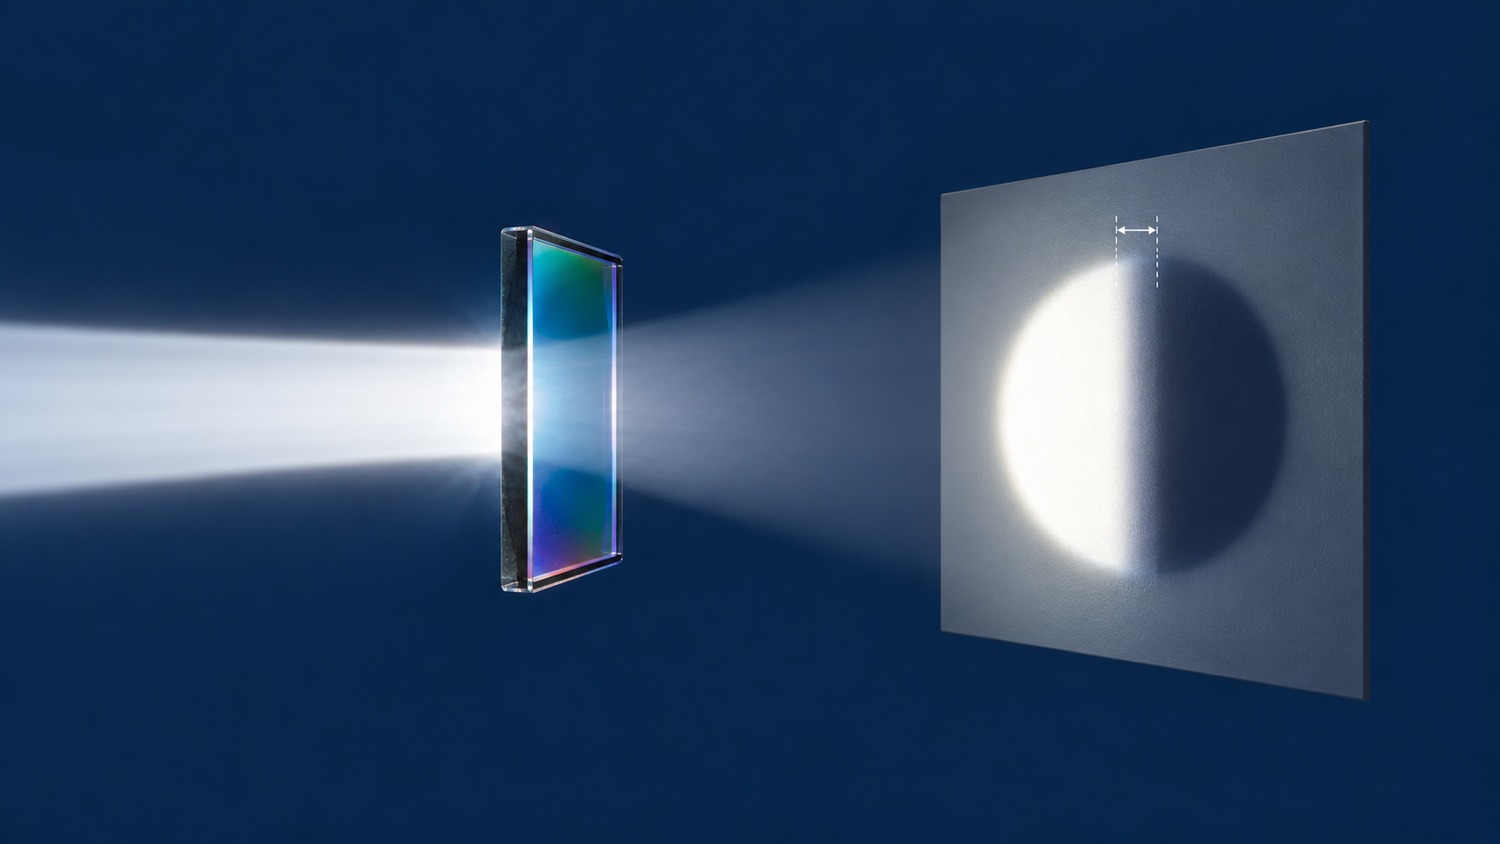
An edge filter changes from blocking to transmitting across a finite spectral interval. A slope specification quantifies that interval, but “1% slope” is incomplete without two transmission thresholds, a reference wavelength and measurement conditions. The useful question is whether two quoted numbers describe the same test.
A longpass edge rises with wavelength; a shortpass edge falls. An absolute wavelength difference works for either direction. Smaller transition widths mean steeper edges, whereas a larger magnitude of transmission change per nanometre means a steeper slope. Keep those conventions separate.
Center wavelength (CWL) and full width at half maximum (FWHM) characterize bandpass filters. A single edge is better specified by threshold wavelengths. Optical density (OD) describes attenuation and remains a separate requirement.
Interference in the coating sets the spectral shape. To extract reproducible numbers, let $T$ be fractional power transmittance and define $\lambda_{10}$ and $\lambda_{90}$ at absolute transmission levels of 10% and 90%. Here the reference is the absolute 50% crossing, $\lambda_{50}$.
$$\Delta\lambda_{10–90}=|\lambda_{90}-\lambda_{10}|,\qquad s_{10–90}=\frac{\Delta\lambda_{10–90}}{\lambda_{50}}\times100\%$$
Crossings at 597 nm and 603 nm around a 600 nm reference give a 6 nm width, or 1%. The corresponding average gradient is 80 percentage points divided by 6 nm: about 13.3 percentage points/nm. This average is distinct from the local derivative.
Relative thresholds give different results. With a 92% passband reference, relative 90% transmission means 82.8% absolute transmission. Specify whether that reference is a peak or an average over a defined interval. Fig. 1 shows how changing endpoint definitions changes the reported width of one edge.
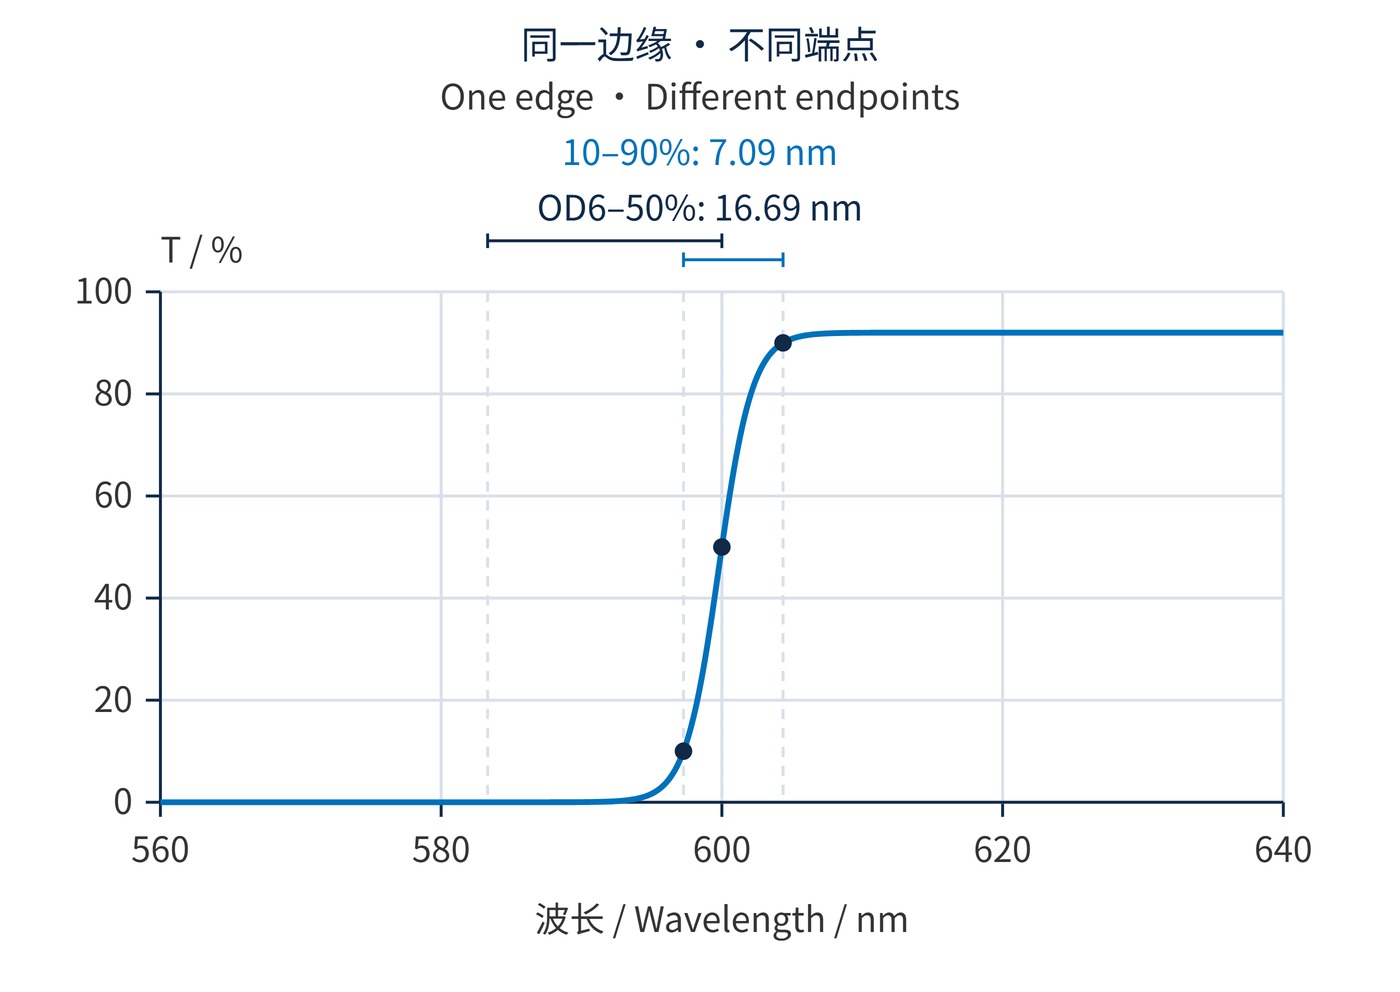
For weak signals, the important interval may extend from deep blocking to useful transmission. An OD6-to-absolute-50% width is one possible agreement; it cannot be substituted for a 10%–90% width.
$$\mathrm{OD}=-\log_{10}T,\qquad\Delta\lambda_{\mathrm{OD6}–50}=|\lambda_{50}-\lambda_{\mathrm{OD6}}|$$
OD6 means $T=10^{-6}$, or 0.0001%. Equal 10%–90% widths do not guarantee equal OD6 crossings. Blocking tails and leakage peaks need separate evaluation. The linear transmission axis in Fig. 1 resolves the main edge but cannot verify OD6.
For Fig. 1, an illustrative logistic response was evaluated every 0.1 nm. Its plateau is 92%, its scale parameter is 1.2 nm, and its absolute 50% crossing is fixed at 600 nm. The two calculated widths are 7.09 nm and 16.69 nm. This is a metric demonstration, rather than a coating prediction or the curve for the separate 6 nm specification example above. The deep-blocking crossing is calculated from the model, not inferred from a visibly flat trace.
Start with the last wavelength that must be blocked and the first that must pass. Reserve margin for edge-position tolerance, temperature and angular shifts. Angle of incidence (AOI), polarization and the angular spread of a converging beam can change the response seen in the instrument.
| Item | Example agreement, not a product guarantee |
|---|---|
| Position and width | Absolute 50% crossing: 600 ± 1 nm; absolute 10%–90% width: ≤6 nm |
| Blocking and transmission | OD≥6 throughout 450–590 nm; transmission ≥90% at every wavelength from 610–750 nm |
| Conditions | AOI 0° ± 0.5°; collimated, unpolarized light; 23 ± 2 °C; measurements within the clear aperture |
| Data | 0.1 nm sampling near crossings; 0.2 nm spectral bandwidth; raw readings and measurement uncertainty |
These instrument settings illustrate a 6 nm edge, not a universal standard. Spectral bandwidth should be substantially narrower than the transition. Finer sampling cannot undo instrument broadening. OD6 also requires adequate dynamic range and stray-light control.
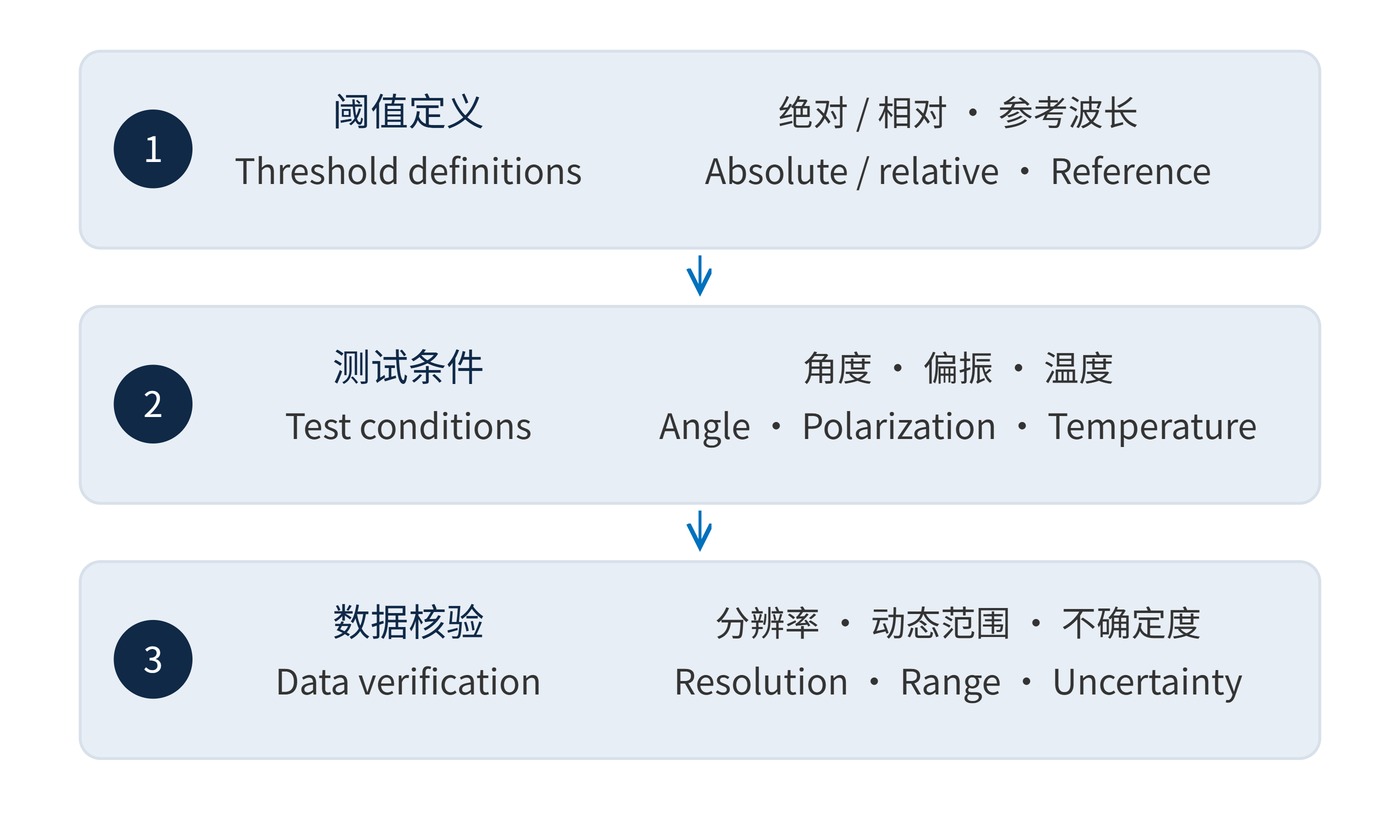
Follow the sequence in Fig. 2. If ripple produces multiple crossings, agree on the valid edge interval and crossing rule before testing. Check that transmission continues to meet its minimum beyond the selected crossing.
On a monotonic section, interpolate between adjacent samples to estimate a threshold crossing and record the interpolation method. For batch comparisons, keep beam size and measurement position consistent. A local scan establishes performance at the sampled location; it does not automatically certify the entire clear aperture.
Fluorescence detection needs both sufficient OD at excitation wavelengths and adequate transmission where emission collection starts. For Raman work, a wavenumber shift can describe proximity to the laser line. Equal wavelength gaps do not imply equal Raman shifts at different laser wavelengths.
$$\Delta\tilde{\nu}=10^{7}\left|\frac{1}{\lambda_{\mathrm{L}}}-\frac{1}{\lambda_{\mathrm{S}}}\right|\,\mathrm{cm}^{-1}$$
Insert numerical wavelength values in nm: a 785 nm laser and a 790 nm signal are separated by approximately 80.6 cm⁻¹. This conversion does not certify laser blocking. In machine vision, compare the edge against actual target and background spectra before paying for a narrower transition.
A useful acceptance plan therefore includes the wavelengths that matter to the system, even when a normalized slope is also supplied. This keeps a favorable headline number from obscuring loss at the desired signal or leakage at a nearby source line.
A brightness transition is easy to misread as a spatial shadow rather than a spectral edge; a filter selects by wavelength instead of blocking part of the beam. Terminology background is available in the Florida State University microscopy primer’s introductory filter material. Traceable acceptance requires endpoint definitions, absolute readings and measurement conditions alongside every slope value.
 365nm Narrow Bandpass Filter | Ø50mm | T>90%
OT-HBP3659050
365nm Narrow Bandpass Filter; FWHM 10nm; transmission >90%; blocking OD5; size Ø50mm; AOI 0°.
 450nm Narrow Bandpass Filter | Ø50mm
OT-HBP4509050
450nm Narrow Bandpass Filter; FWHM 10nm; transmission >90%; blocking OD5; size Ø50mm; AOI 0°.
 525nm Narrow Bandpass Filter | Ø50mm
OT-HBP5259050
525nm Narrow Bandpass Filter; FWHM 10nm; transmission >90%; blocking OD5; size Ø50mm; AOI 0°.
Send us your drawing and spectral targets — an engineer replies with a feasibility check and quotation within one business day.