Original content by the OOTEE Optics editorial team, drawn from first-hand production line and inspection data. Please credit the source when republishing.
Given limits in expertise and test conditions, the theories, parameters and conclusions here carry no guarantee of absolute accuracy. For technical learning and exchange only - never the sole basis for design, acceptance or selection. Corrections welcome.
A reading of 90.0% followed by 89.5% differs by 0.5 percentage points of transmittance, written here as 0.5 %T. The relative difference is about 0.56%. These are different quantities. Excellent repeatability can also coexist with a stable bias, especially when stray light sets the apparent blocking floor.
This article concerns regular transmittance at a specified wavelength and collection aperture. Changing spectral bandwidth, illumination angle or acceptance aperture changes the measured quantity. Establish comparable conditions before interpreting a disagreement as filter degradation.
Let $S$ and $R$ be dark-corrected sample and reference signals. Transmittance $T$ is a fraction; optical density (OD) expresses its logarithm:
$$T=\frac{S}{R},\qquad \mathrm{OD}=-\log_{10}T$$
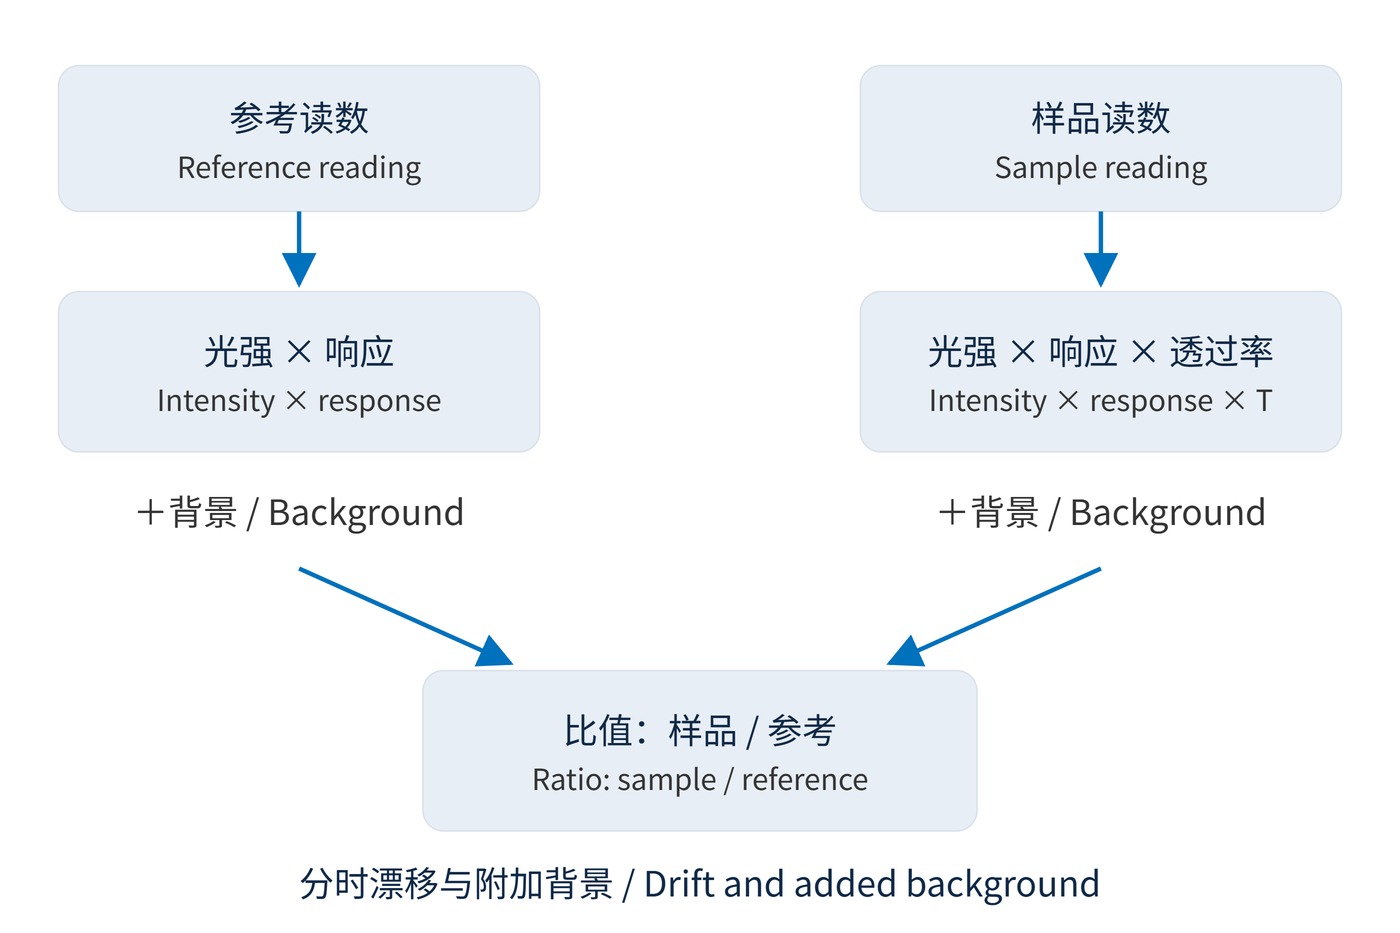
Fig. 1 separates multiplicative changes from added background. Normalization cancels only changes shared by both readings. A source that becomes 0.5% brighter between reference and sample measurements raises a true 90% result by approximately 0.45 %T. Different detector response errors at the two signal levels also survive division.
For a simplified stray-light contribution $s$, normalized to the reference signal and assumed equal in both readings and unattenuated by the sample:
$$T_{\mathrm{meas}}=\frac{T+s}{1+s}$$
With $s=10^{-4}$, a true OD6 filter transmitting 0.0001% reads approximately 0.0101%, close to OD4. Real spectral cross-talk can be wavelength dependent, so a dark-current measurement alone does not establish blocking capability.
The following are conditional engineering estimates, not instrument specifications or confidence intervals. Each row varies one stated factor. Values are absolute reading errors and must not be summed directly.
| Error source | Typical magnitude (%T) and assumptions | Control and priority |
|---|---|---|
| Source drift | 0.09–0.9; 90% transmission with 0.1%–1% sequential intensity drift | Bracket with reference readings; often prominent on a flat passband |
| Stray light | About 0.001–0.1; deep blocking with $s=10^{-5}$–$10^{-3}$ | Validate the background floor; often dominates relative error in blocking |
| Polarization sensitivity | 0.1–1; s/p transmission differs by 10 %T and polarization weighting changes by 0.01–0.1 | Hold polarization fixed, especially at oblique incidence |
| Angle error | About 0.04–0.4; 780 nm, effective index 1.8, 0.1° error near 5°, slope 1–10 %T/nm | Record angle and cone angle; edges are most sensitive |
| Detector linearity | 0.09–0.9; 90% transmission and 0.1%–1% differential response error | Check calibration and gain changes; saturation has no useful bound |
| Sample parallelism and thickness | About 0.1–1; absorbing substrate with $T=0.9$, $\alpha=0.01$–$0.1\ \mathrm{mm}^{-1}$ and 0.1 mm thickness difference | Repeat at the same spot and orientation; wedge-induced clipping may exceed this range |
| Multiple reflections | About 0.15; lossless plate, 4% reflectance per face, first beam versus all transmitted beams | Match collection conditions; coherent fringes can exceed several %T |
The thickness estimate uses $|\Delta T|\approx\alpha T|\Delta d|$; it does not imply that all transparent substrates have this absorption. Wedge affects beam position, clipping and interference. The reflection example compares 92.16% with 92.31%, rather than treating ordinary surface reflection as instrument error.
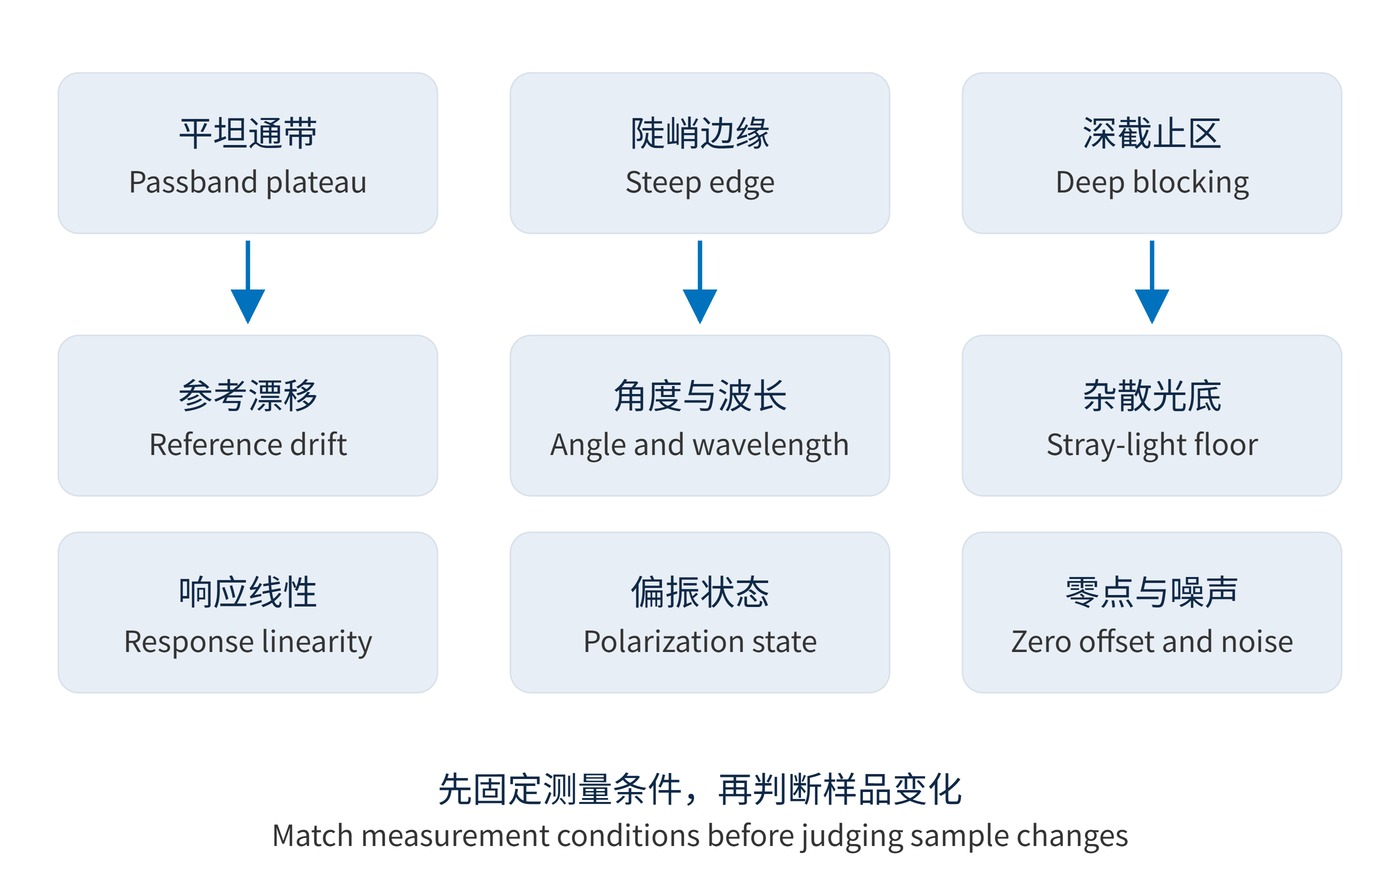
A filter with center wavelength (CWL) 780 nm, full width at half maximum (FWHM) 20 nm and OD6 blocking needs different checks at its peak and in its stopband. Fig. 2 assigns priorities: reference stability and linearity on a plateau, wavelength and angle at an edge, background and zero offset in deep blocking.
A spectral shift becomes a vertical reading difference according to the local slope:
$$\Delta T\approx\frac{\mathrm{d}T}{\mathrm{d}\lambda}\Delta\lambda$$
For an effective index of 1.8 at 780 nm, changing the angle of incidence (AOI) by 0.1° near 5° shifts the band by about 0.037 nm. A 10 %T/nm edge then changes by approximately 0.37 %T. A 0.5 nm shift would instead produce 5 %T at that slope, making edges a higher priority than a plateau.
For narrow bandpass filters, match the spectral bandwidth too. Excessive instrument bandwidth averages peaks and valleys, lowering the measured peak and softening edges. Repeated scans cannot remove this averaging.
When an acceptance test shows a nearly uniform passband offset, compare bracketing references and test response at different light levels with unchanged gain. An edge-only disagreement points first to the wavelength scale and AOI. A strong dependence on sample azimuth warrants a polarization check.
Change one condition per comparison and retain the original data. If a difference follows the reference reading rather than the sample position, investigate the instrument first. If it follows the illuminated spot, investigate sample variation and collection geometry.
In fluorescence or Raman measurements, a flat blocking floor requires a detection-limit check before any rejection decision. Interpreting stopband transmission requires separating leakage from background. Ripples appearing after remounting call for matched spot position, orientation and collection aperture, followed by checks for wedge and returning reflections.
Averaging reduces random noise, not a stable stray-light bias, nonlinearity or drift. Dark subtraction does not remove background present only with the source on. Parallel faces can produce coherent fringes; small thickness or temperature changes can alter their phase.
Combine uncertainty components only after defining distributions, sensitivity coefficients and correlations. Retain wavelength, bandwidth, AOI, polarization, spot, gain and repeatability in the record. Near the background floor, report a detection limit rather than unsupported OD digits.
The mechanisms are discussed in the NIST guide to regular spectral transmittance. Its system-specific performance figures are not the basis for universal ranges in this table.
 365nm Narrow Bandpass Filter | Ø50mm | T>90%
OT-HBP3659050
365nm Narrow Bandpass Filter; FWHM 10nm; transmission >90%; blocking OD5; size Ø50mm; AOI 0°.
 450nm Narrow Bandpass Filter | Ø50mm
OT-HBP4509050
450nm Narrow Bandpass Filter; FWHM 10nm; transmission >90%; blocking OD5; size Ø50mm; AOI 0°.
 525nm Narrow Bandpass Filter | Ø50mm
OT-HBP5259050
525nm Narrow Bandpass Filter; FWHM 10nm; transmission >90%; blocking OD5; size Ø50mm; AOI 0°.
Send us your drawing and spectral targets — an engineer replies with a feasibility check and quotation within one business day.