Original content by the OOTEE Optics editorial team, drawn from first-hand production line and inspection data. Please credit the source when republishing.
Given limits in expertise and test conditions, the theories, parameters and conclusions here carry no guarantee of absolute accuracy. For technical learning and exchange only - never the sole basis for design, acceptance or selection. Corrections welcome.

In a flow cytometer, spillover occurs when fluorescence from one dye reaches a detection channel assigned to another. Overlapping emission spectra produce this effect even with perfect filters. The engineering objective is to retain useful photons while limiting interference and the spread that remains after compensation.
This discussion concerns conventional bandpass detection. Dichroics route light; terminal bandpass filters define the accepted spectrum. Laser leakage needs a separate background budget: laser blocking specifications do not describe rejection of another dye inside the passband.
Center wavelength (CWL) locates the band, full width at half maximum (FWHM) specifies its width at half peak transmission, and optical density (OD) specifies blocking. Angle of incidence (AOI) defines the mounting condition under which these properties must hold.
A channel response depends on the entire detection path:
$$S_{ij}=K_i\int E_j(\lambda)D_i(\lambda)B_i(\lambda)Q_i(\lambda)\,\mathrm{d}\lambda$$
Here $E_j$ is dye $j$'s photon emission spectrum, $D_i$ the product of dichroic routing factors, $B_i$ bandpass transmission, and $Q_i$ detector quantum efficiency. $K_i$ includes collection efficiency and gain. Detector response and gain matter when comparing channels.
As Fig. 1 shows, a split near the overlap region routes wavelengths rather than identifying dyes. The intersection is only a starting point. Real dichroics have finite transitions and polarization-dependent responses.
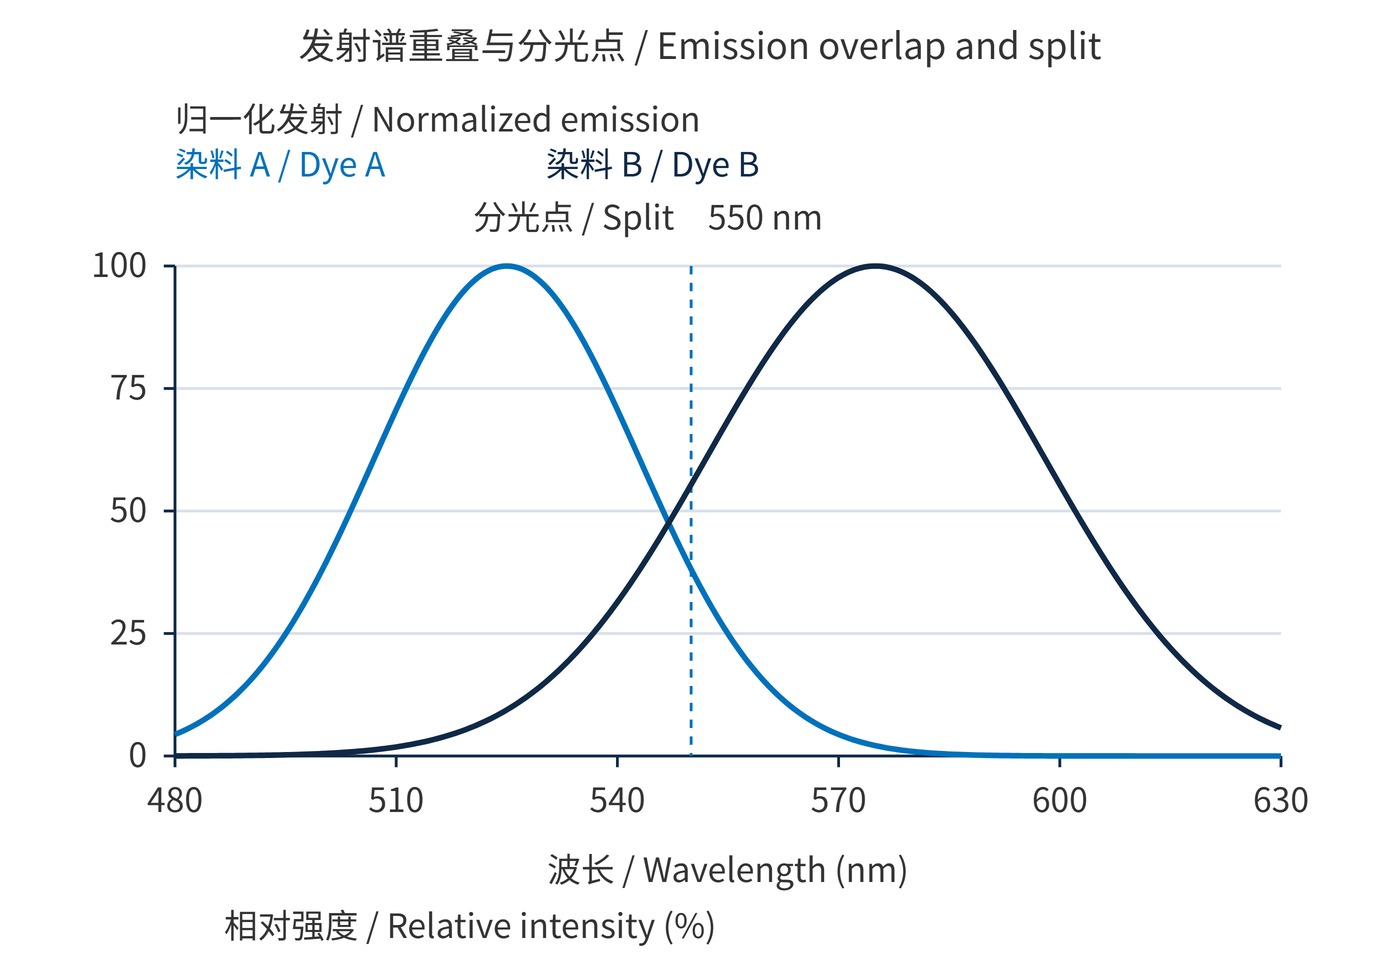
Fig. 1 uses Gaussian emission functions sampled every 0.5 nm. Dye A has a 525 nm peak and 18 nm standard deviation; B has a 575 nm peak and 23 nm standard deviation. Each peak is normalized to 100%. These are illustrative spectra, and 550 nm is not a universal split recommendation.
Blocking follows the intensity transmission ratio:
$$\mathrm{OD}(\lambda)=-\log_{10}T(\lambda)$$
OD6 means $T=10^{-6}$, or 0.0001%, at the specified wavelength. Stronger out-of-band blocking cannot reject another dye's photons that already lie inside the desired passband.
Start with measured dye spectra, excitation conditions and detector response. Sweep candidate split positions alongside both terminal passbands. Specify dichroic mirrors at the working AOI, such as 45°, including s and p polarization and the incident angular range.
In Fig. 2, the ideal 550 nm split stays fixed while the B passband narrows from 555–595 nm to 565–585 nm. It retains approximately 54.6% of B's signal and 26.6% of A's leakage. With equal emission peaks and flat quantum efficiency, the A/B integral ratio falls from about 6.1% to 3.0%. This ratio is not an instrument compensation coefficient.
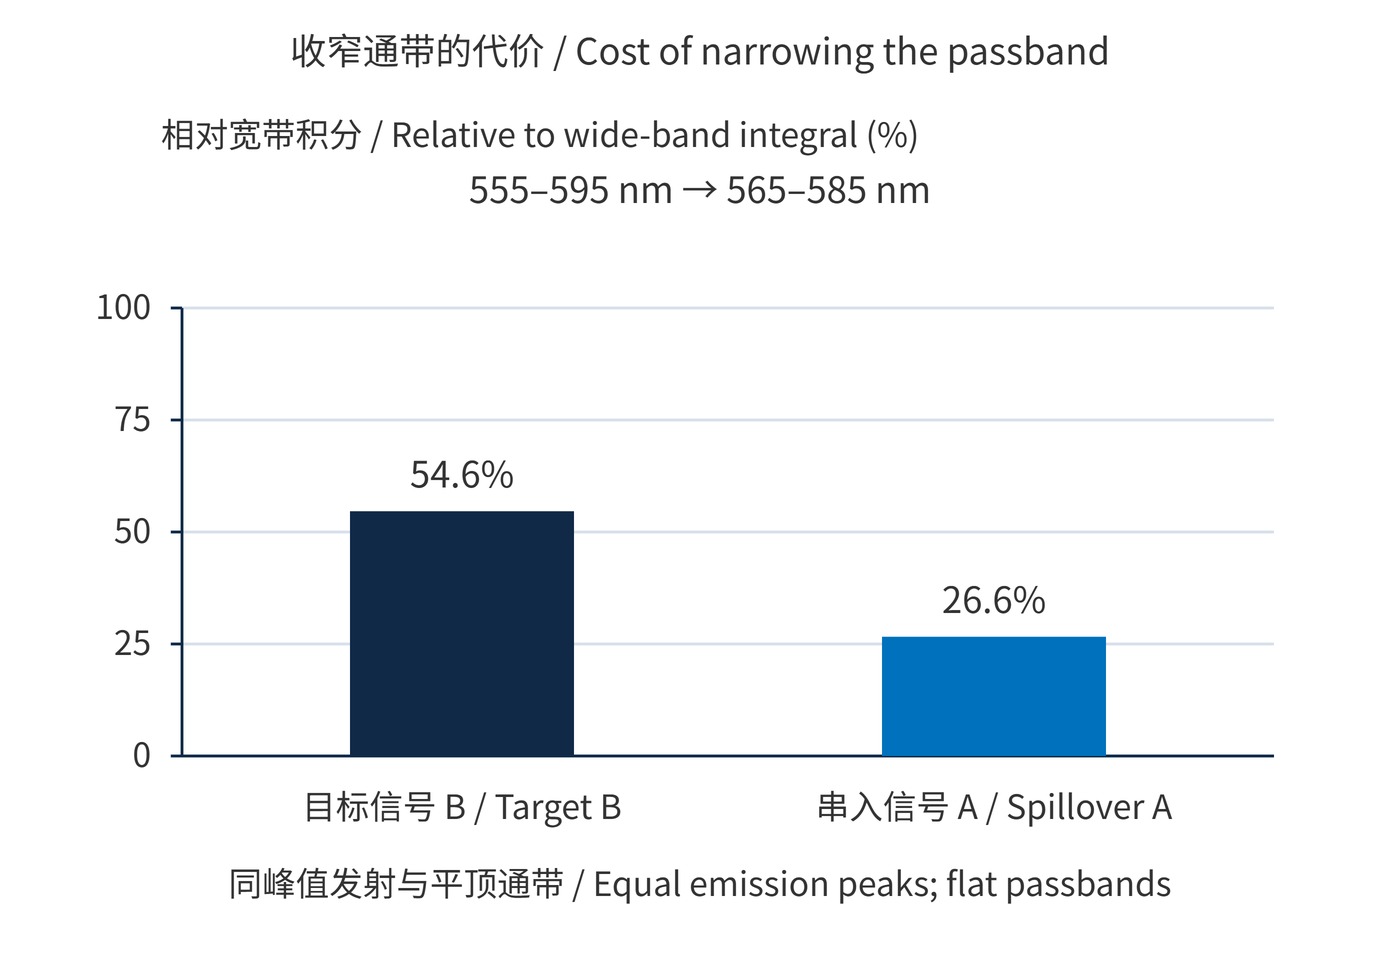
Fig. 2 uses the same spectra, ideal flat passbands with 100% transmission inside and 0% outside, constant path efficiency and quantum efficiency, and 0.5 nm integration steps. Each bar is normalized to its own wide-band integral.
| Design item | Illustrative starting specification | Validation |
|---|---|---|
| B bandpass | CWL 575 nm; FWHM 20 nm | Compare dim-positive separation against 40 nm bandwidth |
| Laser rejection | OD6 at the 488 nm laser line | Include wavelength drift and mounting angles |
| Dichroic | 550 nm split; AOI 45° | Check transition width and s/p spectra |
A narrower band is most useful when it removes a region rich in unwanted emission without sacrificing the photons needed for population separation. Conversely, a brighter interfering dye can dominate even a small overlap integral. Repeat the calculation at the expected relative dye brightness, then verify it with controls at the intended instrument settings. The preferred edge position therefore depends on the assay as well as the nominal spectral curves.
These are starting values. Compare bandpass filters using average transmission, edge tolerances, clear aperture and batch spectra. Moving the split changes the other channel's photon budget too.
For immunophenotyping, judge a bright marker's spillover by its effect on dim-positive separation. Narrowing a band may lower background while also losing enough target photons to obscure the weak population.
Keep laser power and detector gain fixed during comparisons. Establish compensation with matched single-stain controls; assess gating with fully stained and fluorescence-minus-one controls. Revalidate after changing tandem-dye lots, fixation conditions or optical components.
For linear, unsaturated measurements with background accounted for:
$$\mathbf{y}=\mathbf{M}\mathbf{x}+\mathbf{b},\qquad \hat{\mathbf{x}}=\mathbf{M}^{-1}(\mathbf{y}-\mathbf{b})$$
The response matrix $\mathbf{M}$ comes from single-stain controls. Compensation corrects mean spillover, but cannot remove photon shot noise. A nearly singular matrix amplifies errors; saturation, drift and mismatched controls also invalidate the correction.
The flow cytometry research guidelines caution that compensation coefficients alone do not predict spreading error. Acceptance should therefore examine residual single-stain offsets, compensated negative-population spread and dim-positive separation together.
 365nm Narrow Bandpass Filter | Ø50mm | T>90%
OT-HBP3659050
365nm Narrow Bandpass Filter; FWHM 10nm; transmission >90%; blocking OD5; size Ø50mm; AOI 0°.
 450nm Narrow Bandpass Filter | Ø50mm
OT-HBP4509050
450nm Narrow Bandpass Filter; FWHM 10nm; transmission >90%; blocking OD5; size Ø50mm; AOI 0°.
 525nm Narrow Bandpass Filter | Ø50mm
OT-HBP5259050
525nm Narrow Bandpass Filter; FWHM 10nm; transmission >90%; blocking OD5; size Ø50mm; AOI 0°.
Send us your drawing and spectral targets — an engineer replies with a feasibility check and quotation within one business day.