Original content by the OOTEE Optics editorial team, drawn from first-hand production line and inspection data. Please credit the source when republishing.
Given limits in expertise and test conditions, the theories, parameters and conclusions here carry no guarantee of absolute accuracy. For technical learning and exchange only - never the sole basis for design, acceptance or selection. Corrections welcome.
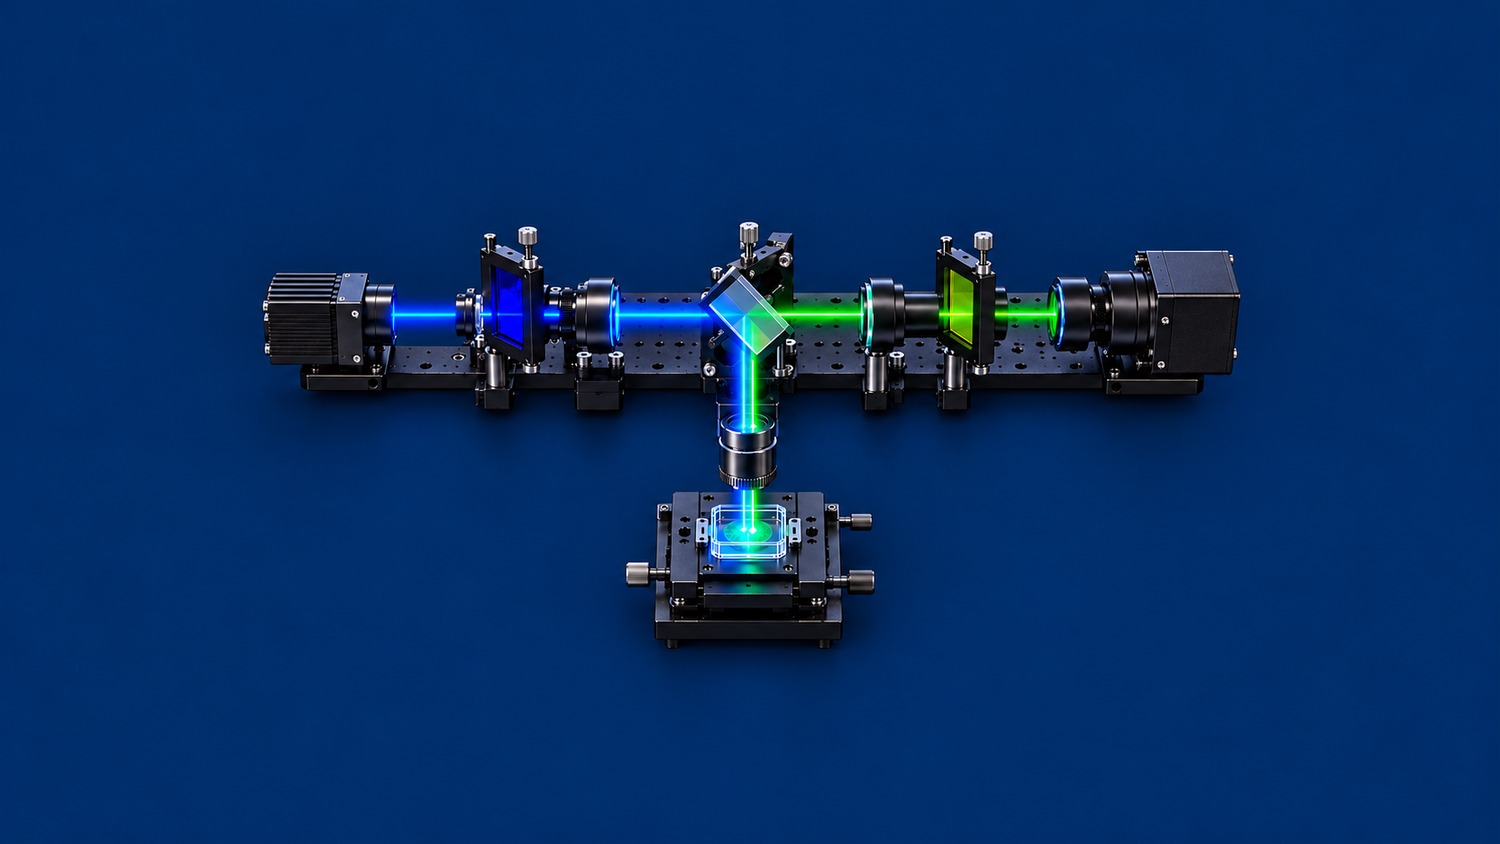
A fluorescence filter set combines an excitation filter, a dichroic beamsplitter and an emission filter. The excitation filter cleans the illumination spectrum. The dichroic routes excitation toward the specimen and separates returning fluorescence. The emission filter selects the detection band and rejects residual excitation. Their spectral overlap matters more than any single peak transmission value.
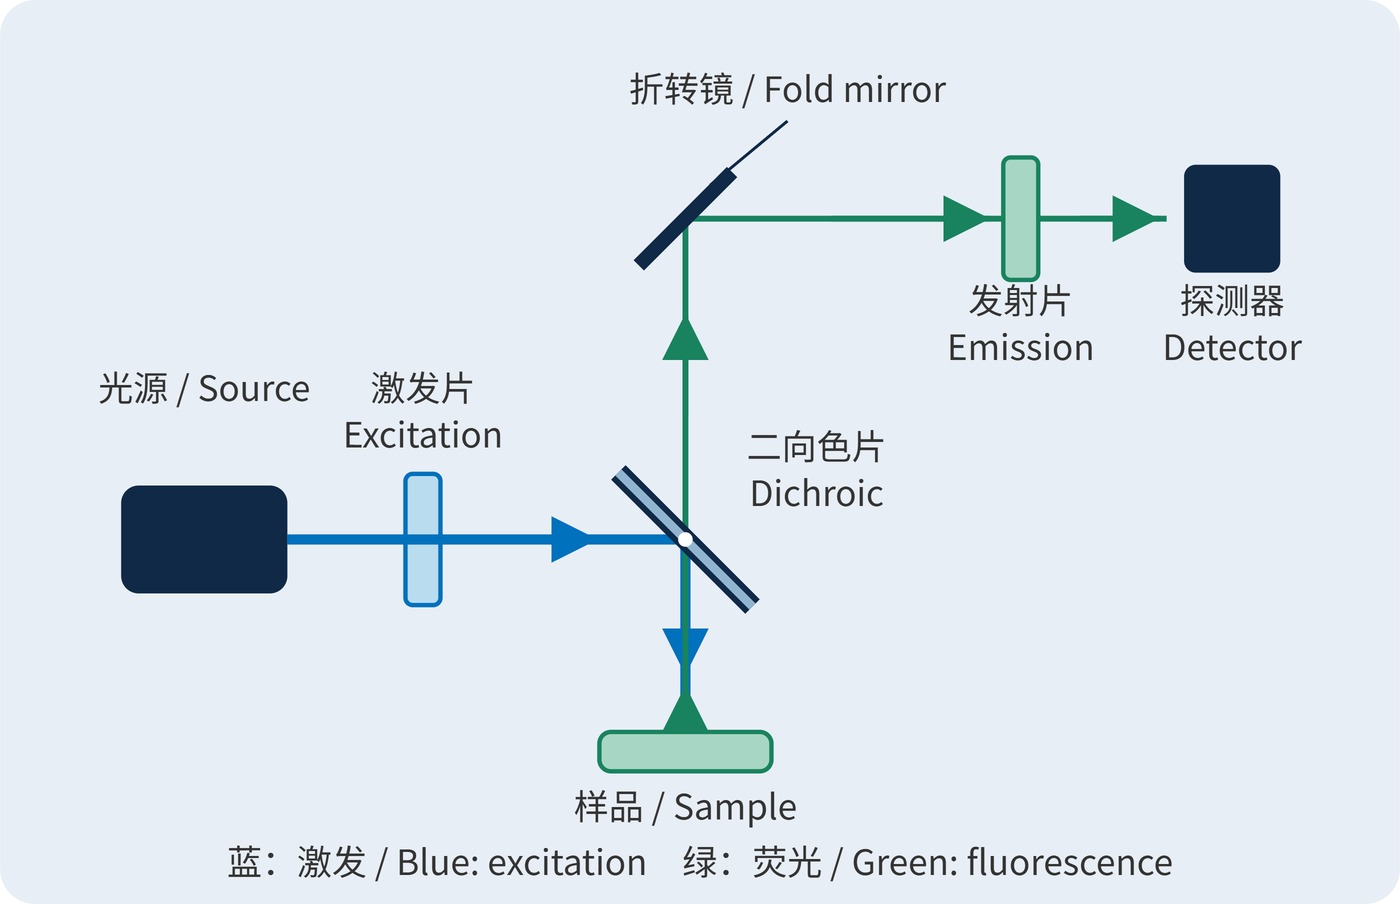
In a common epi-fluorescence arrangement, spectral separation uses the Stokes shift between excitation and emission. Fluorescence spreads in many directions; the objective collects only a fraction. In Fig. 1, blue light reflects downward at the dichroic, while returning green light transmits straight through it. An additional fold mirror routes the detection arm to the right.
Specify center wavelength (CWL), full width at half maximum (FWHM), optical density (OD) and angle of incidence (AOI) with their applicable wavelength ranges. The excitation passband belongs inside the dichroic reflection band; the emission passband belongs inside its transmission band. Leave margin for edge tolerances and angular shifts rather than placing useful fluorescence in the dichroic transition.
For transmission $T$ expressed as a fraction, blocking is defined by:
$$\mathrm{OD}(\lambda)=-\log_{10}T(\lambda)$$
OD6 means $T=10^{-6}$, or 0.0001%, within the specified blocking range and test conditions. OD values add only at the same wavelength along the same serial path, neglecting multiple reflections and bypass light. The excitation filter is in the illumination arm: its OD cannot simply be added to blocking in the return arm.
With fixed illumination and a sample in its linear response regime, detected signal can be approximated from the collected fluorescence spectral photon flux $F(\lambda)$:
$$S\propto\int F(\lambda)T_{\mathrm{d}}(\lambda)T_{\mathrm{em}}(\lambda)Q(\lambda)\,\mathrm{d}\lambda$$
Here $T_{\mathrm{d}}$ and $T_{\mathrm{em}}$ describe dichroic and emission-filter transmission, and $Q$ is detector quantum efficiency. Signal depends on the weighted spectral overlap. Changing illumination also requires reassessing excitation efficiency, bleaching and saturation.
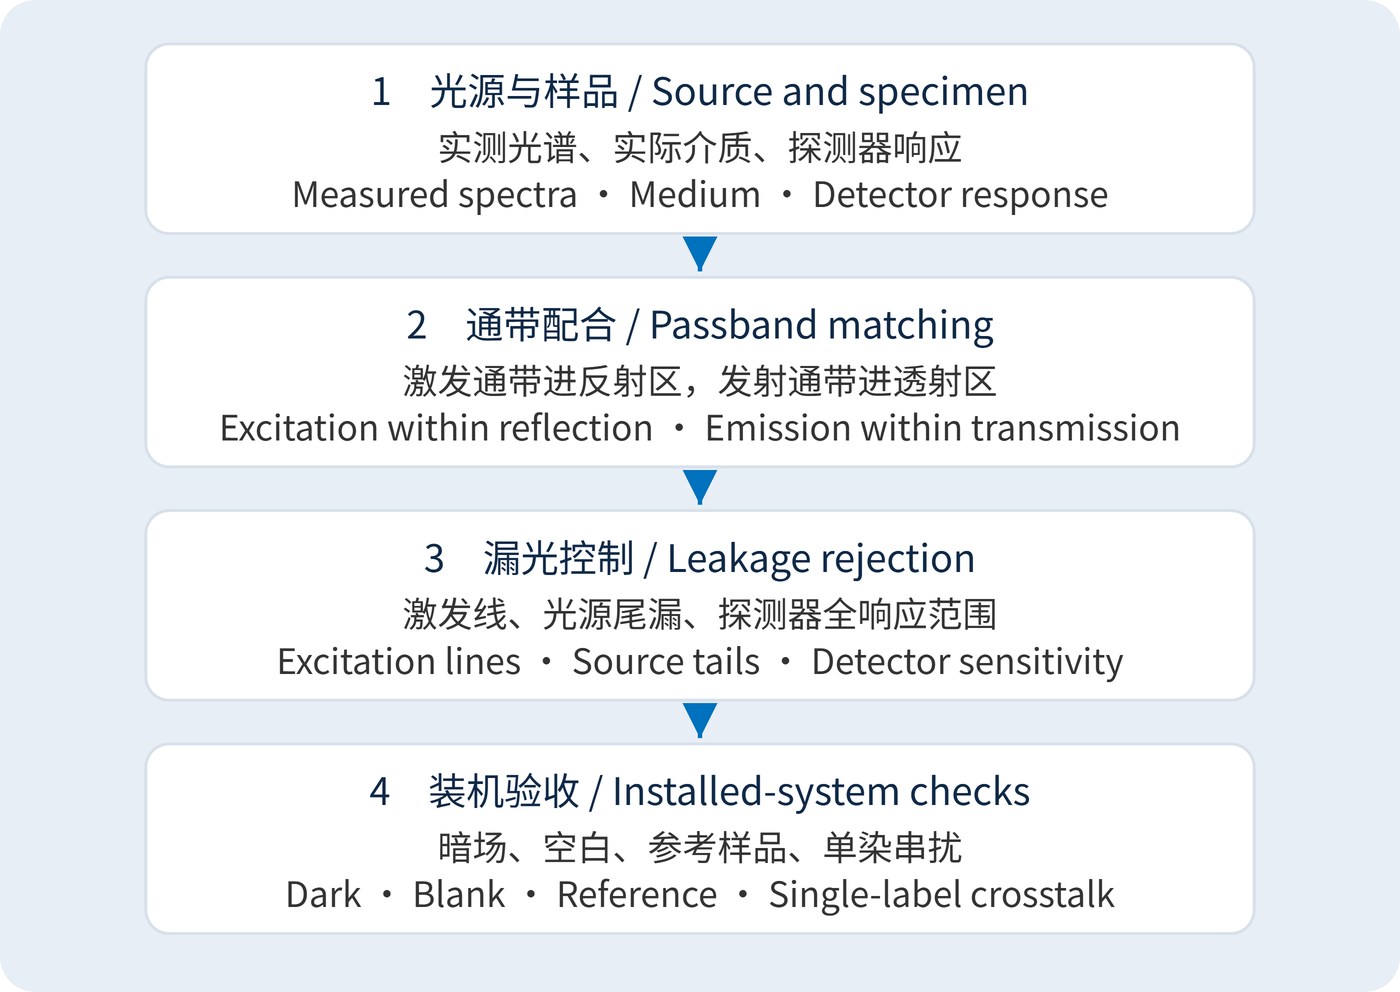
Start with the measured source spectrum, fluorophore spectra in the actual medium and detector response. Fig. 2 outlines the sequence: define useful signal first, then allocate the splitting edge and blocking bands. The following blue-excitation/green-detection values are illustrative design targets, not a product specification or universal recommendation.
| Element | Example target | Matching requirement |
|---|---|---|
| Excitation | CWL 470 nm; FWHM 40 nm | Agree minimum transmission over 450–490 nm; check green spectral leakage |
| Dichroic | AOI 45°; transition near 505 nm | Reflection ≥95% over 450–490 nm; transmission ≥90% over 515–545 nm |
| Emission | CWL 530 nm; FWHM 30 nm | Specify minimum transmission separately over 515–545 nm; blocking ≥OD6 over 450–490 nm |
FWHM locates the half-height boundaries; it guarantees neither high transmission throughout a window nor out-of-band rejection. Source leakage near 530 nm will pass the emission filter and must be removed upstream. Extend blocking specifications to other source wavelengths within detector sensitivity, including near-infrared leakage where relevant.
Specify operating angles, beam cone, polarization, clear aperture, mounting orientation and temperature. Request dichroic reflection and transmission at 45°, with separate S and P data where needed. Normal-incidence bandpass data do not establish performance in an oblique beam.
Widefield microscopy balances photon collection against background. Multicolor imaging also needs checks for excitation and emission crosstalk from every other dye; independently suitable single-color sets may interact. Laser-scanning instruments require rejection data at the actual laser lines, rather than an average across a broad blocking interval.
In fluorescence readers and microfluidic instruments, scattered light and cell-wall reflections can dominate background. Measure a dark frame, a nonfluorescent blank and a fluorescence reference, followed by single-label samples for cross-channel response. Keep exposure, gain and illumination constant so leakage and signal loss can be distinguished.
For the basic epi-fluorescence geometry, see the Florida State University microscopy primer. Acceptance should rely on complete-set spectra and background measurements under the agreed operating conditions.
 365nm Narrow Bandpass Filter | Ø50mm | T>90%
OT-HBP3659050
365nm Narrow Bandpass Filter; FWHM 10nm; transmission >90%; blocking OD5; size Ø50mm; AOI 0°.
 450nm Narrow Bandpass Filter | Ø50mm
OT-HBP4509050
450nm Narrow Bandpass Filter; FWHM 10nm; transmission >90%; blocking OD5; size Ø50mm; AOI 0°.
 525nm Narrow Bandpass Filter | Ø50mm
OT-HBP5259050
525nm Narrow Bandpass Filter; FWHM 10nm; transmission >90%; blocking OD5; size Ø50mm; AOI 0°.
Send us your drawing and spectral targets — an engineer replies with a feasibility check and quotation within one business day.