Original content by the OOTEE Optics editorial team, drawn from first-hand production line and inspection data. Please credit the source when republishing.
Given limits in expertise and test conditions, the theories, parameters and conclusions here carry no guarantee of absolute accuracy. For technical learning and exchange only - never the sole basis for design, acceptance or selection. Corrections welcome.
Nanometer-level center wavelength (CWL) precision means controlling the difference between a filter’s measured center and its target under stated conditions. A specification such as 780 nm ±1 nm describes spectral placement. It does not specify a 1 nm coating thickness tolerance, and extra digits on a spectrometer do not establish accuracy.
For a single continuous passband, this article defines CWL as the midpoint of the two half-maximum crossings. Full width at half maximum (FWHM) is their separation. The wavelength of maximum transmission can differ from that midpoint, particularly with ripple or an asymmetric profile. Complex passbands need an agreed extraction method.
$$\lambda_{\mathrm{CWL}}=\frac{\lambda_1+\lambda_2}{2},\qquad \mathrm{FWHM}=\lambda_2-\lambda_1,\qquad T(\lambda_{1,2})=\frac{T_{\mathrm{peak}}}{2}$$
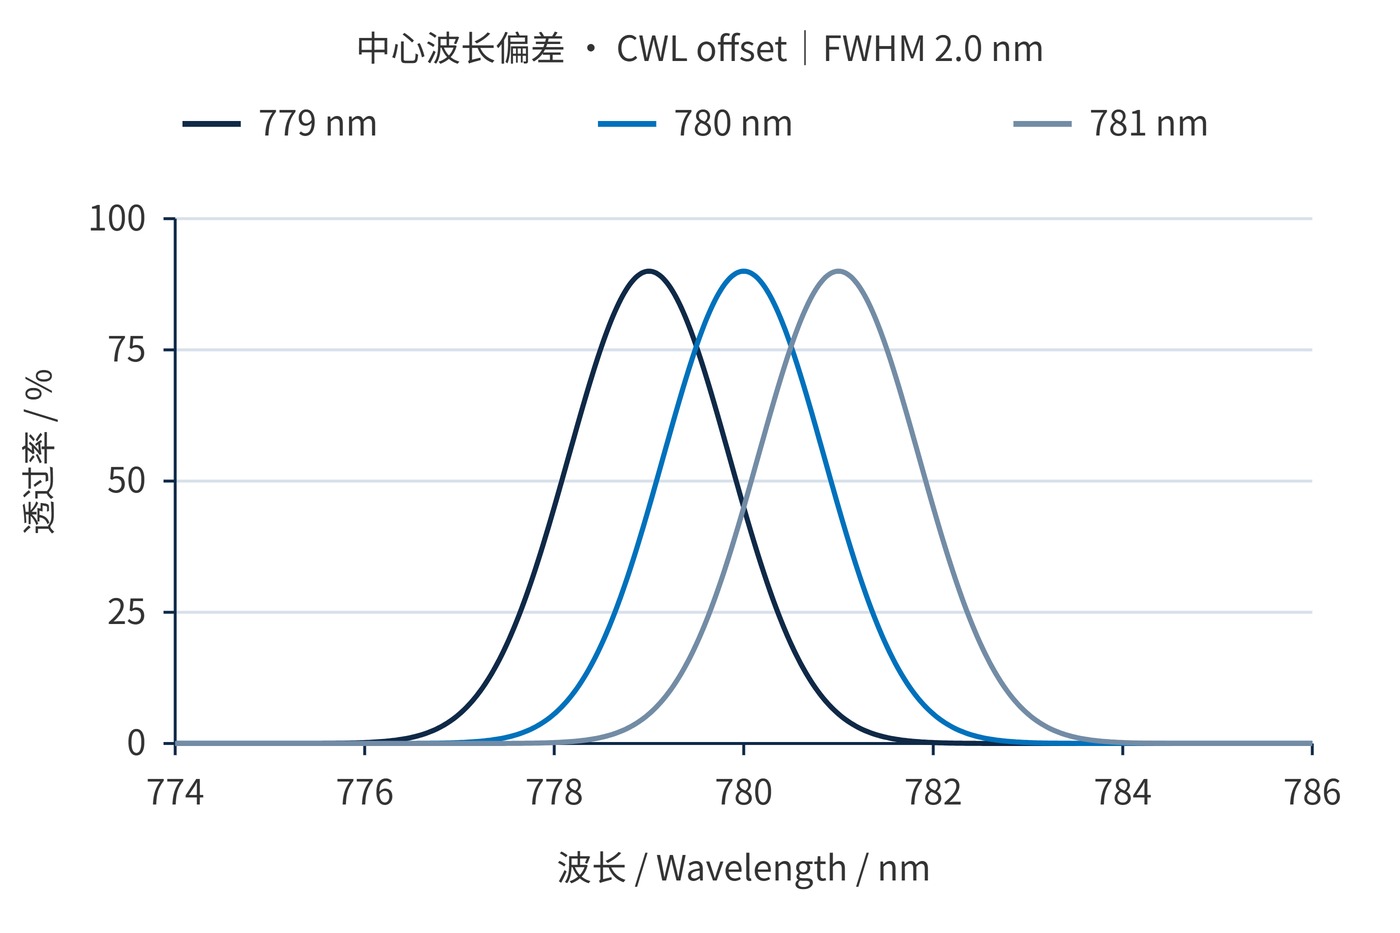
Fig. 1 separates placement from width: three identical profiles have different centers. Narrowing a passband does not automatically improve its placement accuracy. It can instead make transmission at a fixed laser wavelength more sensitive to a small offset.
Dielectric multilayers select wavelengths through interference. Optical thickness combines refractive index and physical thickness. At fixed angle, approximately scaling all optical thicknesses produces an approximately equal fractional shift in wavelength:
$$\frac{\delta\lambda}{\lambda}\approx\frac{\delta(nd)}{nd}$$
A 1 nm shift at 780 nm represents about 0.128%. This is a scale sensitivity estimate, not a universal allowance for every layer. In a multicavity design, individual layer errors affect center, width and ripple differently.
Precision starts with sensitivity analysis and continues through stable deposition, optical endpoint monitoring and witness-sample checks. Monitoring transmission or reflection can guide layer termination and, where the design permits, compensation in later layers. It cannot recover every possible deposition error.
Final scans and measurements across the clear aperture verify the result. A passing center spot does not establish whole-aperture compliance. Angle of incidence (AOI), beam cone, polarization and temperature must also be controlled so that operating shifts are not mistaken for manufacturing errors.
The monitor and the delivered part also need a demonstrated relationship. A witness sample can occupy a different position in the deposition chamber, while the final substrate may sample a spatial thickness gradient. Correlating witness results with finished-part scans is therefore part of establishing spectral placement, rather than treating the witness reading as the delivered specification.
Begin with the source wavelength range and acceptable signal loss. Allocate the available margin among manufacturing tolerance, temperature and mounting effects. Use worst-case combinations for guaranteed limits; statistical combination requires justified distributions and independence.
| Parameter | Illustrative requirement | Conditions to state |
|---|---|---|
| CWL | 780 nm ±1 nm | Half-maximum midpoint; 23 °C; AOI 0° |
| FWHM | 2.0 nm ±0.2 nm | Half of each profile’s own peak |
| Signal transmission | ≥80% at 780 nm | Test beam and clear aperture |
| Optical density (OD) | OD6 over 400–750 nm and 810–1000 nm | Blocking range and measurement dynamic range |
These entries illustrate specification language, not a validated product. In Fig. 1, shifting the Gaussian center by 1 nm reduces transmission at 780 nm from 90% to 45%. The stated CWL tolerance therefore does not ensure the table’s signal requirement. Tighter placement, another profile shape or a revised width would be necessary.
Measurement records should distinguish wavelength calibration, instrument spectral bandwidth, scan interval, remounting repeatability and temperature effects. A 0.1 nm sampling interval is not a claim of 0.1 nm accuracy. Instrument bandwidth can broaden and lower a narrow peak; interpolation cannot replace missing information. Wavelength calibration work published by NIST on picometer-level uncertainty highlights wavelength-scale calibration and pixel-interval characterization.
One conservative decision rule, if agreed by both parties, requires the measured offset plus expanded uncertainty to remain inside the tolerance:
$$\left|\widehat{\lambda}_{\mathrm{CWL}}-\lambda_{\mathrm{target}}\right|+U\leq a$$
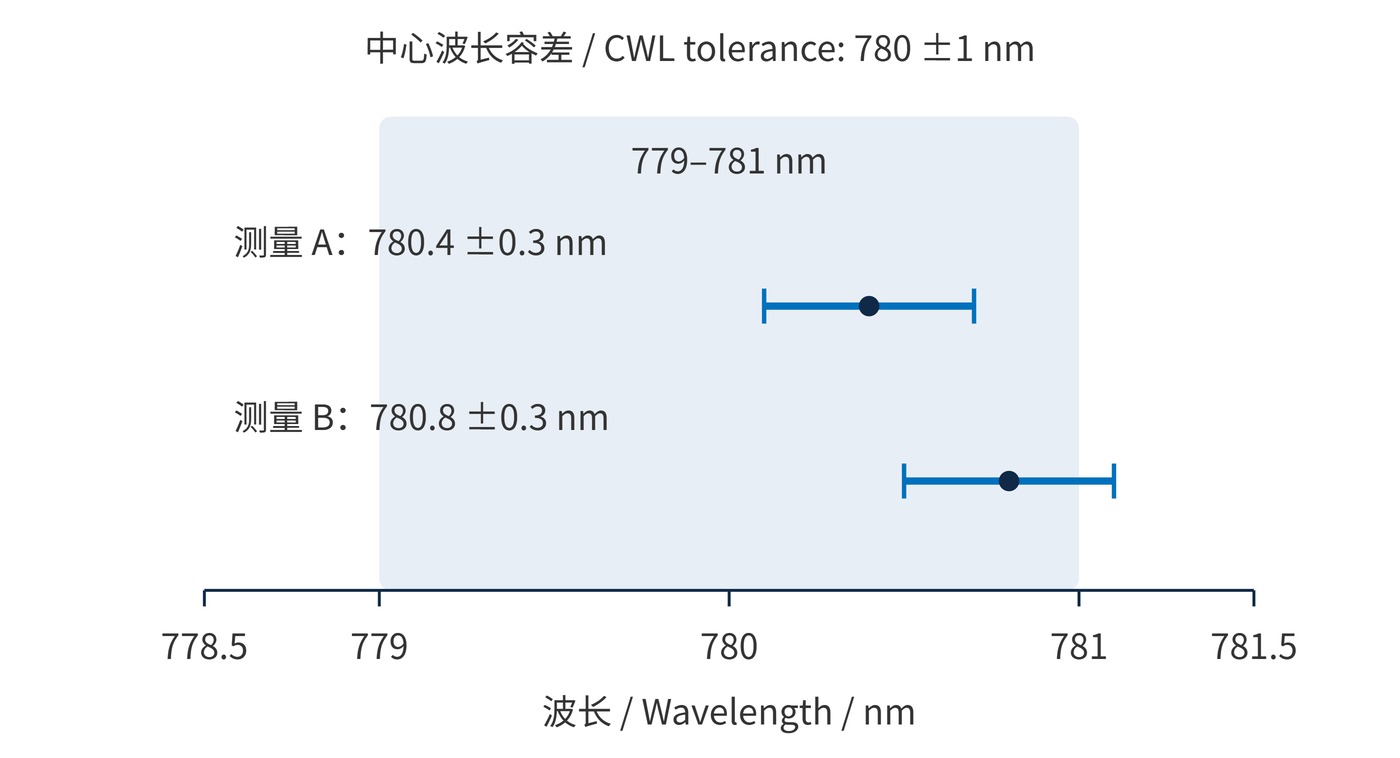
Here $a$ is the tolerance half-width and $U$ is expanded uncertainty in nm; the report should state its coverage factor. As Fig. 2 shows, a reading inside the nominal limits may fail this rule: two independent measurements give 780.4 ± 0.3 nm and 780.8 ± 0.3 nm, the first with margin and the second close to the 781 nm limit. Borderline parts need an agreed retest or disposition process.
For the illustrated ±1 nm limit, result A has an offset of 0.4 nm and an uncertainty of 0.3 nm, leaving its entire interval within tolerance. Result B has an offset of 0.8 nm with the same uncertainty; its upper bound extends beyond 781 nm. This does not prove the part is physically outside tolerance, but it prevents acceptance under this particular rule.
Fixed-line laser detection needs minimum transmission across the source’s drift range, rather than peak transmission alone. Adjacent spectroscopic channels require center-spacing and crosstalk checks. Fluorescence systems must also collect the emission spectrum: an unnecessarily narrow band can discard useful signal.
For instrument production, link scans to serial numbers, measurement positions and conditions. Comparing incoming inspection with the installed state helps separate coating placement from shifts introduced by the optical assembly.
A defensible nanometer-level claim connects an agreed center definition, controlled measurement conditions, a calibrated wavelength scale and a decision that accounts for uncertainty.
 365nm Narrow Bandpass Filter | Ø50mm | T>90%
OT-HBP3659050
365nm Narrow Bandpass Filter; FWHM 10nm; transmission >90%; blocking OD5; size Ø50mm; AOI 0°.
 450nm Narrow Bandpass Filter | Ø50mm
OT-HBP4509050
450nm Narrow Bandpass Filter; FWHM 10nm; transmission >90%; blocking OD5; size Ø50mm; AOI 0°.
 525nm Narrow Bandpass Filter | Ø50mm
OT-HBP5259050
525nm Narrow Bandpass Filter; FWHM 10nm; transmission >90%; blocking OD5; size Ø50mm; AOI 0°.
Send us your drawing and spectral targets — an engineer replies with a feasibility check and quotation within one business day.