Original content by the OOTEE Optics editorial team, drawn from first-hand production line and inspection data. Please credit the source when republishing.
Given limits in expertise and test conditions, the theories, parameters and conclusions here carry no guarantee of absolute accuracy. For technical learning and exchange only - never the sole basis for design, acceptance or selection. Corrections welcome.
Peak transmission is the highest transmittance within the intended passband under specified test conditions. It describes one point on a spectrum. It does not tell an engineer how reliably a detector can distinguish the desired signal from unwanted light. A filter reaching 98% may deliver a poorer measurement than one reaching 90% if the first also admits substantially more background.
Center wavelength (CWL), full width at half maximum (FWHM), optical density (OD), and angle of incidence (AOI) establish the context. Compare filters at the same temperature, polarization, illuminated aperture, and operating angle. The useful decision here is a system noise budget, rather than a ranking of maximum transmission values.
A detector receives an entire spectrum, weighted by its own quantum efficiency. Let $s(\lambda)$ be the incident signal photon flux density, $\eta(\lambda)$ the quantum efficiency, and $t$ the integration time. The expected signal photoelectron count is:
$$N_{\mathrm{s}}=t\int s(\lambda)T(\lambda)\eta(\lambda)\,\mathrm{d}\lambda$$
For flux density in photons per second per nm, integrate wavelength in nm. Substituting the background spectrum $b(\lambda)$ gives the background count $N_{\mathrm{b}}$. Even modest leakage becomes significant when the incident background is intense or extends over a broad detector response.
For a linear, unsaturated detector without internal multiplication, a useful signal-to-noise ratio (SNR) estimate is:
$$\mathrm{SNR}=\frac{N_{\mathrm{s}}}{\sqrt{N_{\mathrm{s}}+N_{\mathrm{b}}+N_{\mathrm{d}}+\sigma_{\mathrm{r}}^2}}$$
Here $N_{\mathrm{d}}$ is the mean dark-electron count during the exposure and $\sigma_{\mathrm{r}}$ is the RMS read noise in electrons. Counts follow independent Poisson statistics. The expression assumes a known background mean; subtracting a separately acquired background adds that measurement's uncertainty. Removing an offset does not remove shot noise. See this technical guide to SNR calculation for the quadrature treatment of noise.
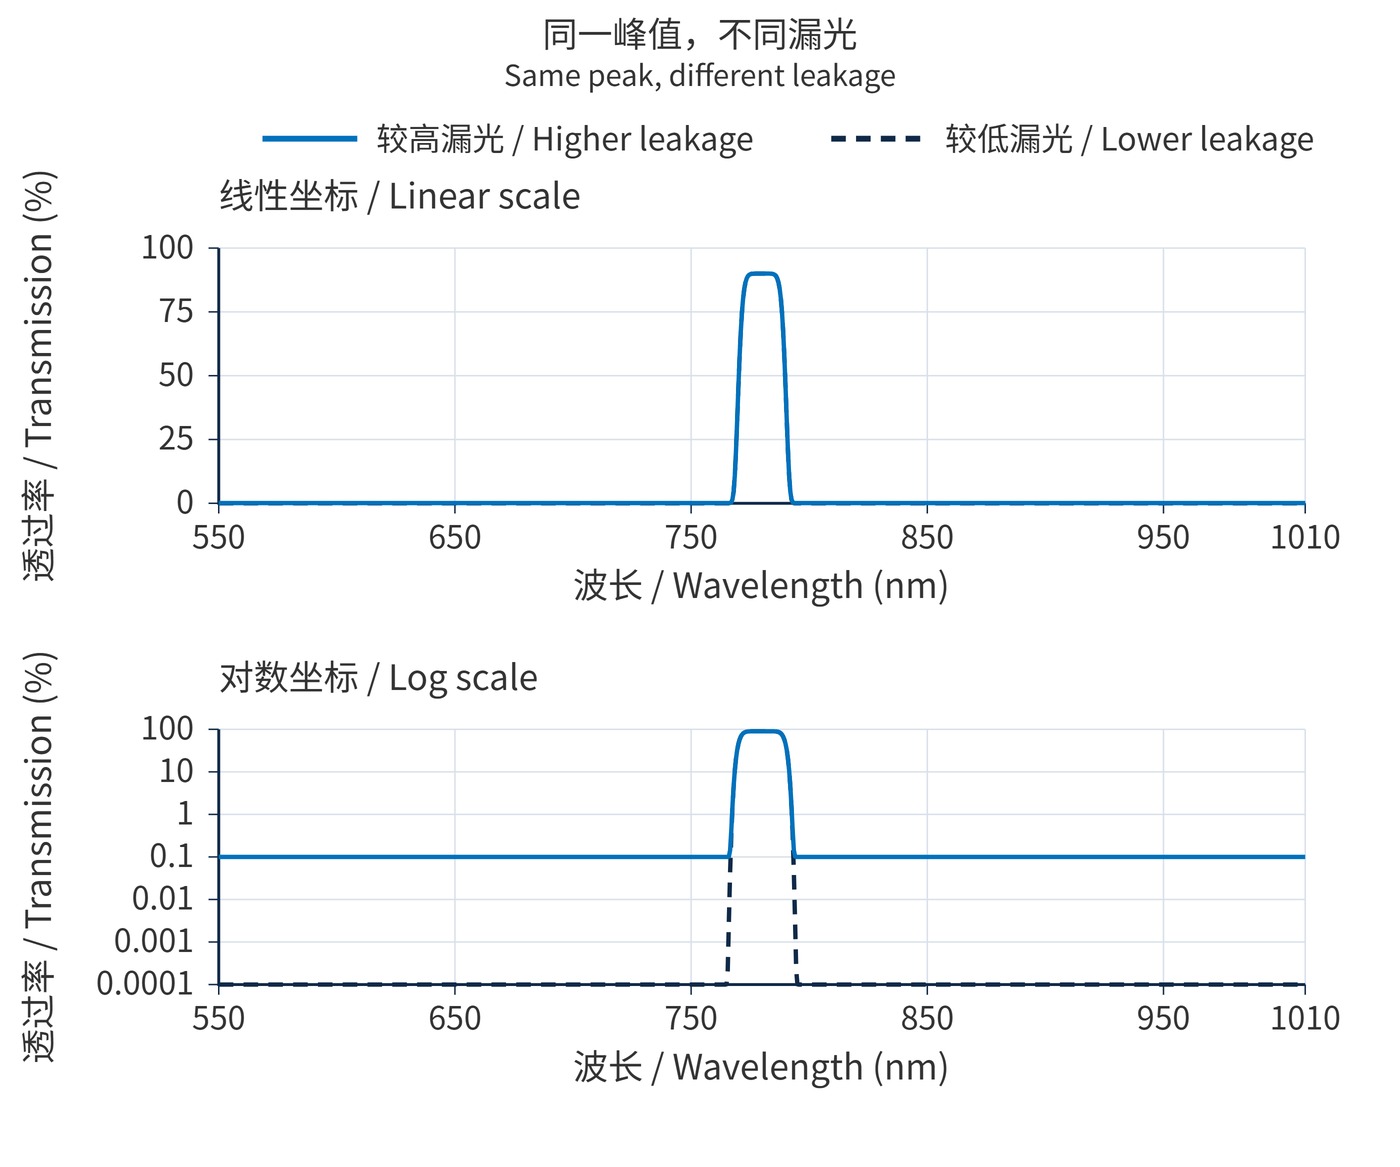
As Fig. 1 shows, equal peaks can conceal very different leakage floors. Both calculated curves use the same passband model; only the leakage floor changes. They are illustrative responses, not measured products, and do not imply that increasing peak transmission necessarily weakens blocking.
Start with the source and background spectra and the detector response. Consider a narrow signal at 780 nm that would generate 1000 electrons without a filter, plus interference at 850 nm that would generate 1000000 electrons. Exposure is fixed, dark current is negligible, and RMS read noise is 5 electrons.
| Calculated quantity | Option A | Option B |
|---|---|---|
| Transmission at 780 nm | 98% | 90% |
| Blocking at 850 nm | OD3; 0.1% | OD6; 0.0001% |
| Signal electrons | 980 | 900 |
| Background electrons | 1000 | 1 |
| SNR | 21.9 | 29.6 |
The signal sits at the peak, other spectral contributions are negligible, and bandwidth and operating conditions are equal. Option B loses about 8.2% of the signal electrons but improves SNR by about 35%. With essentially no background, A instead reaches approximately 30.9 versus B's 29.6. Lower peak transmission is not intrinsically beneficial.
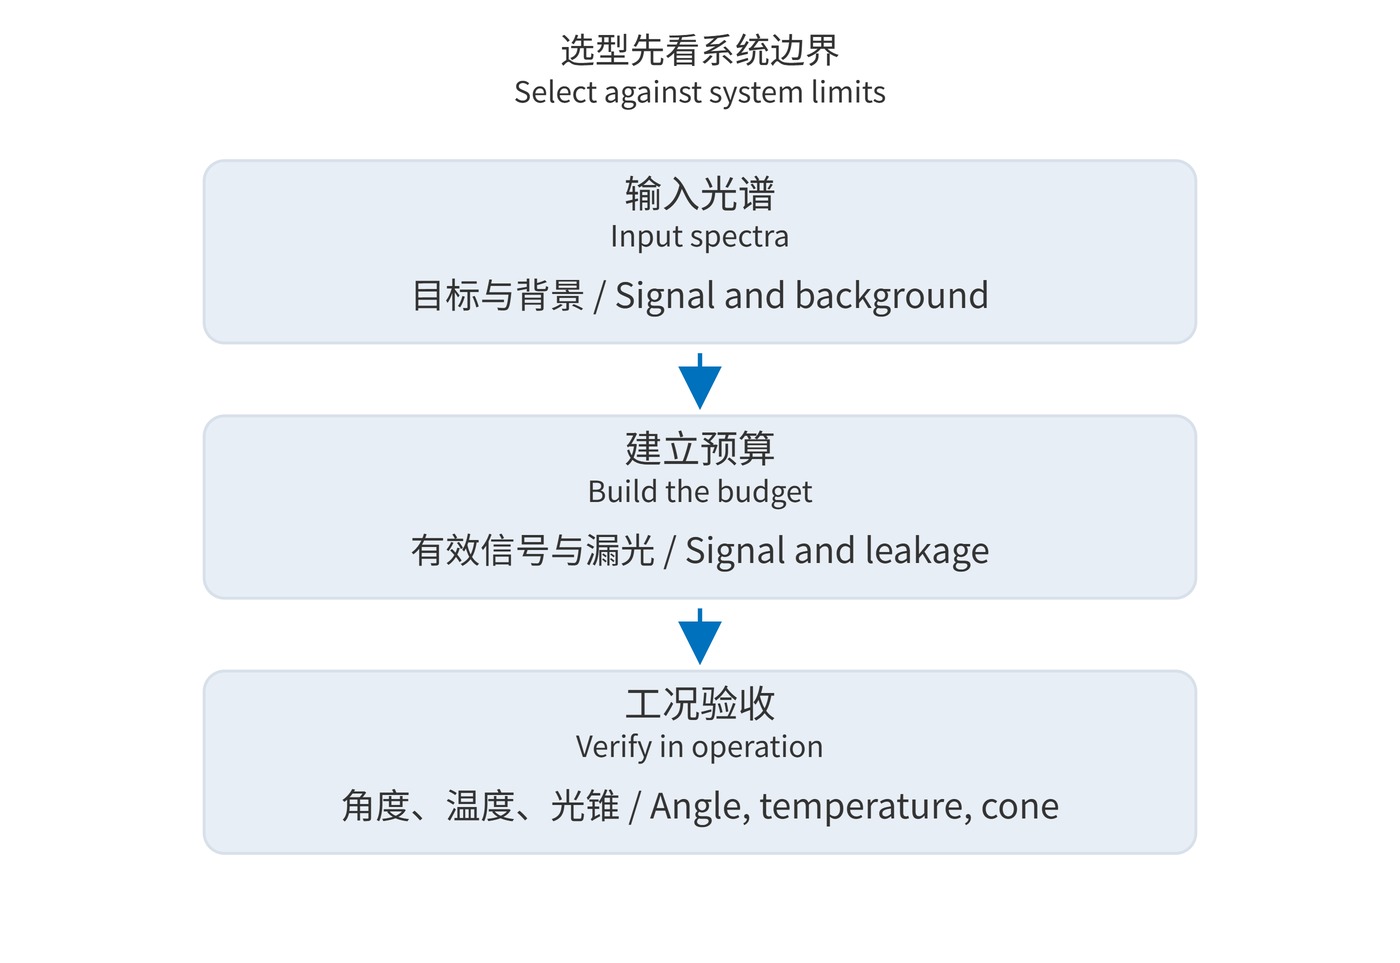
Fig. 2 outlines the selection sequence. A starting specification might require CWL 780 nm, FWHM 20 nm, at least 85% transmission throughout 770–790 nm, and OD6 over 400–750 nm and 810–1100 nm. State AOI 0°, temperature 20 °C, polarization, and measurement resolution. Specify transition regions separately; OD6 cannot simply be assumed there.
In weak fluorescence measurements, scattered excitation can overwhelm emission. Suppress excitation leakage before optimizing emission throughput. Background at the same wavelength as the target cannot be removed by deeper out-of-band blocking; illumination, apertures, or collection geometry must also change.
Outdoor active imaging requires integrating solar background over the detector response, including wavelengths far from the signal. Conversely, a stable narrow-line source in a low-background, photon-limited instrument usually benefits directly from higher transmission at its operating wavelength. The dominant noise source determines the priority.
Optimize signal distinguishability at the required exposure and environment while remaining below saturation. Peak transmission belongs in that calculation as an input; it is not a complete system performance criterion.
 365nm Narrow Bandpass Filter | Ø50mm | T>90%
OT-HBP3659050
365nm Narrow Bandpass Filter; FWHM 10nm; transmission >90%; blocking OD5; size Ø50mm; AOI 0°.
 450nm Narrow Bandpass Filter | Ø50mm
OT-HBP4509050
450nm Narrow Bandpass Filter; FWHM 10nm; transmission >90%; blocking OD5; size Ø50mm; AOI 0°.
 525nm Narrow Bandpass Filter | Ø50mm
OT-HBP5259050
525nm Narrow Bandpass Filter; FWHM 10nm; transmission >90%; blocking OD5; size Ø50mm; AOI 0°.
Send us your drawing and spectral targets — an engineer replies with a feasibility check and quotation within one business day.