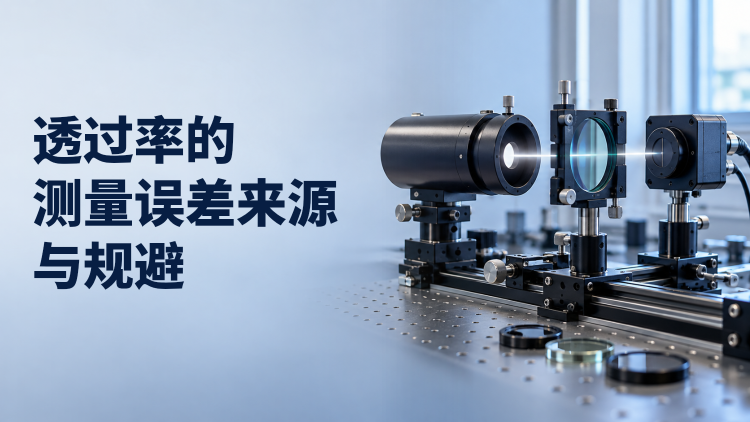
Original content by the OOTEE Optics editorial team, drawn from first-hand production line and inspection data. Please credit the source when republishing.
Given limits in expertise and test conditions, the theories, parameters and conclusions here carry no guarantee of absolute accuracy. For technical learning and exchange only - never the sole basis for design, acceptance or selection. Corrections welcome.

A spectrometer records detector signal versus wavelength. A filter transmission curve requires a reference measurement, a sample measurement and a dark measurement under controlled conditions. The result belongs to a specified illumination and collection geometry, so those conditions must accompany the data.
A basic bench uses a broadband source, collimating optics, a sample holder, collection optics and a spectrometer. An array instrument records many wavelengths together; a scanning spectrophotometer selects successive wavelength bands. Both require normalization to separate filter transmission from the source spectrum.
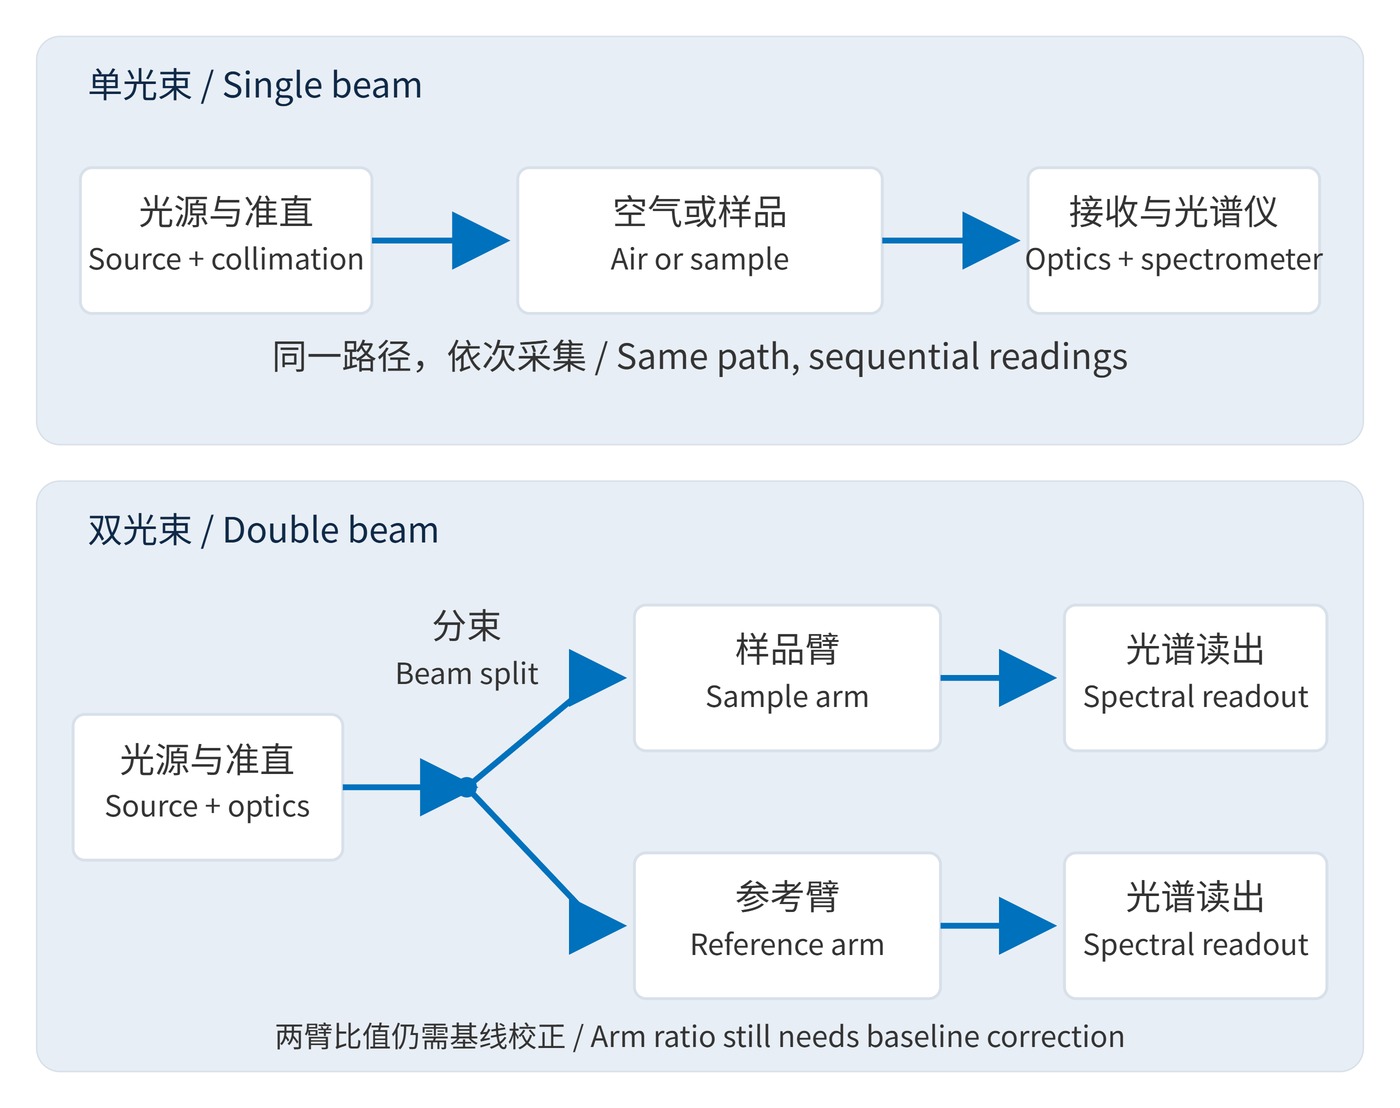
Fig. 1 compares the arrangements. A single-beam system measures the reference and sample sequentially in one path. A double-beam system reads sample and reference arms simultaneously or alternately, tracking common source changes. It still needs a baseline to account for unequal arm responses.
For sample signal $S(\lambda)$, reference signal $R(\lambda)$ and dark signal $D(\lambda)$, the single-beam calculation is:
$$T(\lambda)=\frac{S(\lambda)-D(\lambda)}{R(\lambda)-D(\lambda)}$$
Here $T$ is a fraction; multiply by 100 for %. Acquire the dark signal with incident light blocked and acquisition settings unchanged. For a double-beam instrument, let $q$ be the dark-corrected sample-to-reference arm ratio and $q_0$ its no-sample baseline:
$$T(\lambda)=\frac{q(\lambda)}{q_0(\lambda)}$$
This normalization follows the NIST description of double-beam baseline correction. A raw arm ratio alone is insufficient.
Follow the source warm-up instructions, then check repeated reference spectra for stability. Set integration time so the reference uses the detector's linear range without saturation. Add averaging afterward. Normally keep integration time and gain identical for reference and sample; raw counts acquired with different settings cannot simply be divided.
Do this check over the full scan range, rather than at one bright wavelength. A reference that looks strong near the passband may be weak elsewhere. If exposure settings must change, use a validated normalization method and acquire the corresponding dark and reference data. Do not assume that multiplying counts by an exposure-time ratio is sufficient without checking detector linearity.
Match the source and detector to the wavelength range, with useful reference signal throughout. For a narrow bandpass filter with center wavelength (CWL) 780 nm and full width at half maximum (FWHM) 20 nm, a 650–950 nm scan is a practical starting window for the passband. It does not establish blocking over the full specified range.
| Setting | Starting example | Decision criterion |
|---|---|---|
| Spectral resolution | 1 nm or finer | Substantially narrower than the feature |
| Sampling interval | 0.5 nm | Finer sampling cannot restore unresolved detail |
| Integration and averaging | 20 ms, 10 acquisitions | Trial values; adjust against reference saturation |
| Angle of incidence | 0° | Match intended use; record beam cone angle too |
Fig. 2 shows the sequence. For an air baseline, retain the holder and remove only the filter. A matched blank substrate instead defines transmission relative to that blank. An air-referenced result includes the finished substrate and surfaces; the two reference conventions are not interchangeable.
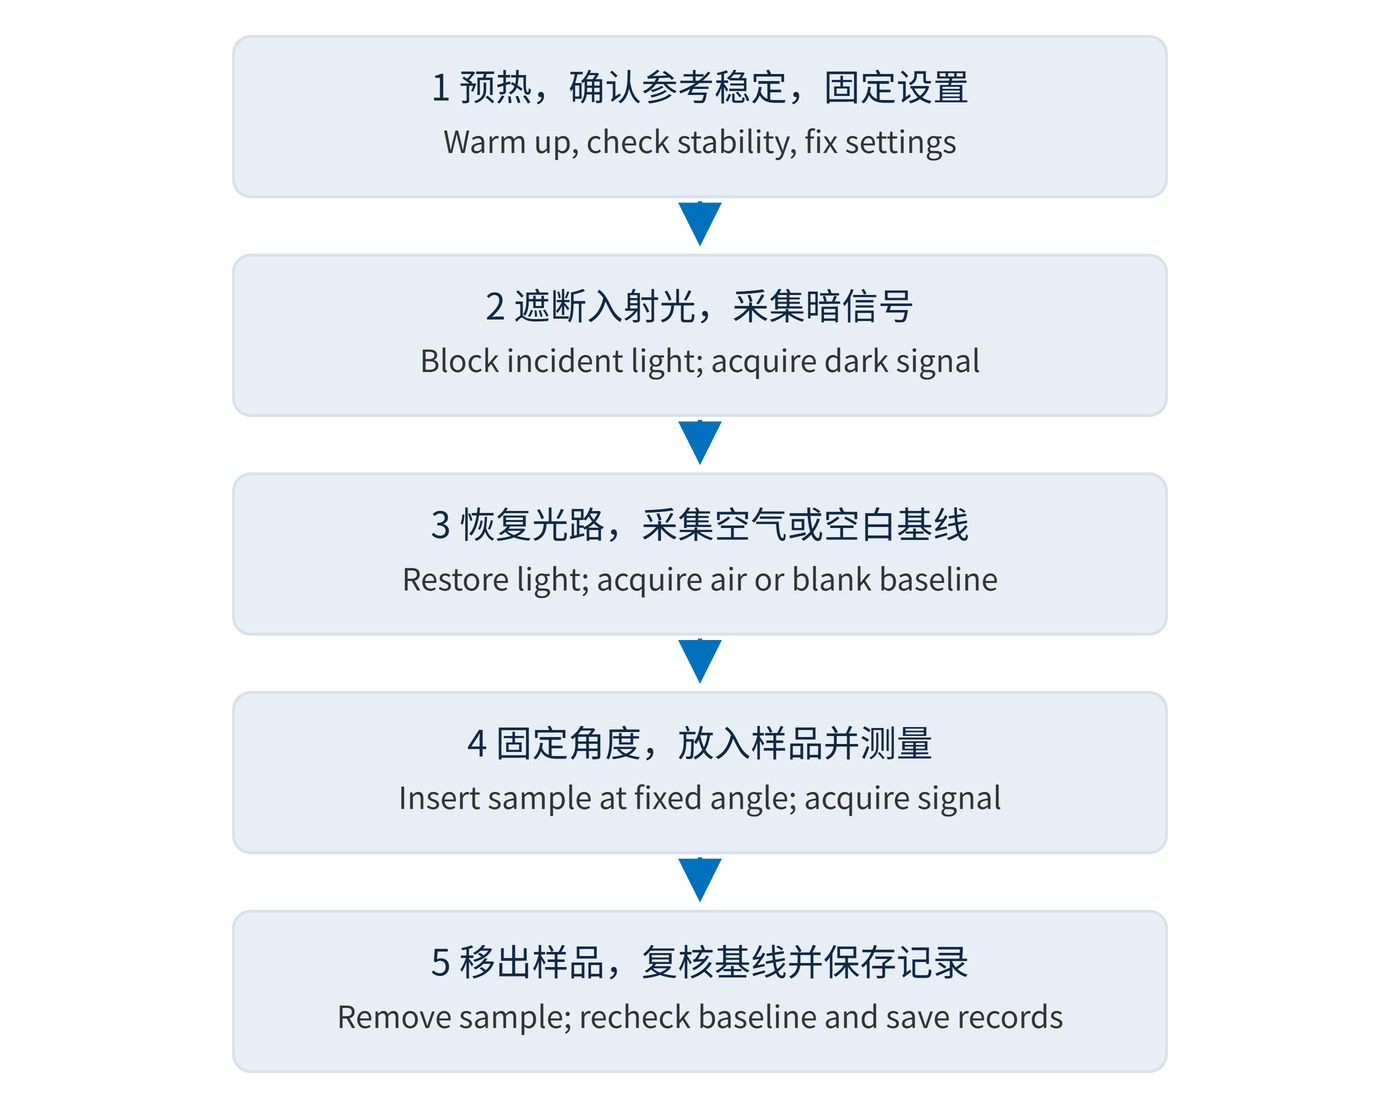
Locate the sample by its edge and keep the beam inside the clear aperture. Record angle of incidence (AOI) and coating orientation. Tilting the sample to maximize transmission changes the test condition. Preserve source alignment, fiber routing and collection position between measurements, then reinstall the reference to check repeatability.
Choose single-beam operation when the source remains stable over the reference-to-sample interval and the measurement can be completed promptly. A reference arm is useful for longer scans or repeated measurements, provided both arms have adequate signal. The choice concerns how the measurement follows changes during acquisition; it does not change the definition of transmission.
Incoming inspection benefits from one repeatable fixture. Save wavelength/transmission data together with dark and reference spectra, integration time, averaging count and date. For installation checks, reproduce the operating AOI and beam geometry as closely as practical.
State whether the result is referenced to air or to a blank substrate. Keep the original readings as well as the normalized curve so that a later comparison can use the same reference convention and acquisition conditions.
Blocking measurements need a separately verified measurement range. Optical density (OD) is defined by:
$$\mathrm{OD}(\lambda)=-\log_{10}T(\lambda)$$
OD6 means 0.0001% transmission. Measuring a passband near 90% does not demonstrate OD6 capability. Report results below the validated measurement floor as limits.
Double-beam operation does not eliminate the air or blank baseline, nor does it correct sample repositioning automatically. Averaging reduces random fluctuation but cannot repair saturation. Avoid calculating ratios where the reference is barely above the dark signal.
A flat baseline near 100% is only one check. Verify wavelength and photometric performance, measure the sample, and recheck the reference. Reference definition, acquisition settings and collection geometry make the resulting curves technically comparable.
 365nm Narrow Bandpass Filter | Ø50mm | T>90%
OT-HBP3659050
365nm Narrow Bandpass Filter; FWHM 10nm; transmission >90%; blocking OD5; size Ø50mm; AOI 0°.
 450nm Narrow Bandpass Filter | Ø50mm
OT-HBP4509050
450nm Narrow Bandpass Filter; FWHM 10nm; transmission >90%; blocking OD5; size Ø50mm; AOI 0°.
 525nm Narrow Bandpass Filter | Ø50mm
OT-HBP5259050
525nm Narrow Bandpass Filter; FWHM 10nm; transmission >90%; blocking OD5; size Ø50mm; AOI 0°.
Send us your drawing and spectral targets — an engineer replies with a feasibility check and quotation within one business day.