Original content by the OOTEE Optics editorial team, drawn from first-hand production line and inspection data. Please credit the source when republishing.
Given limits in expertise and test conditions, the theories, parameters and conclusions here carry no guarantee of absolute accuracy. For technical learning and exchange only - never the sole basis for design, acceptance or selection. Corrections welcome.
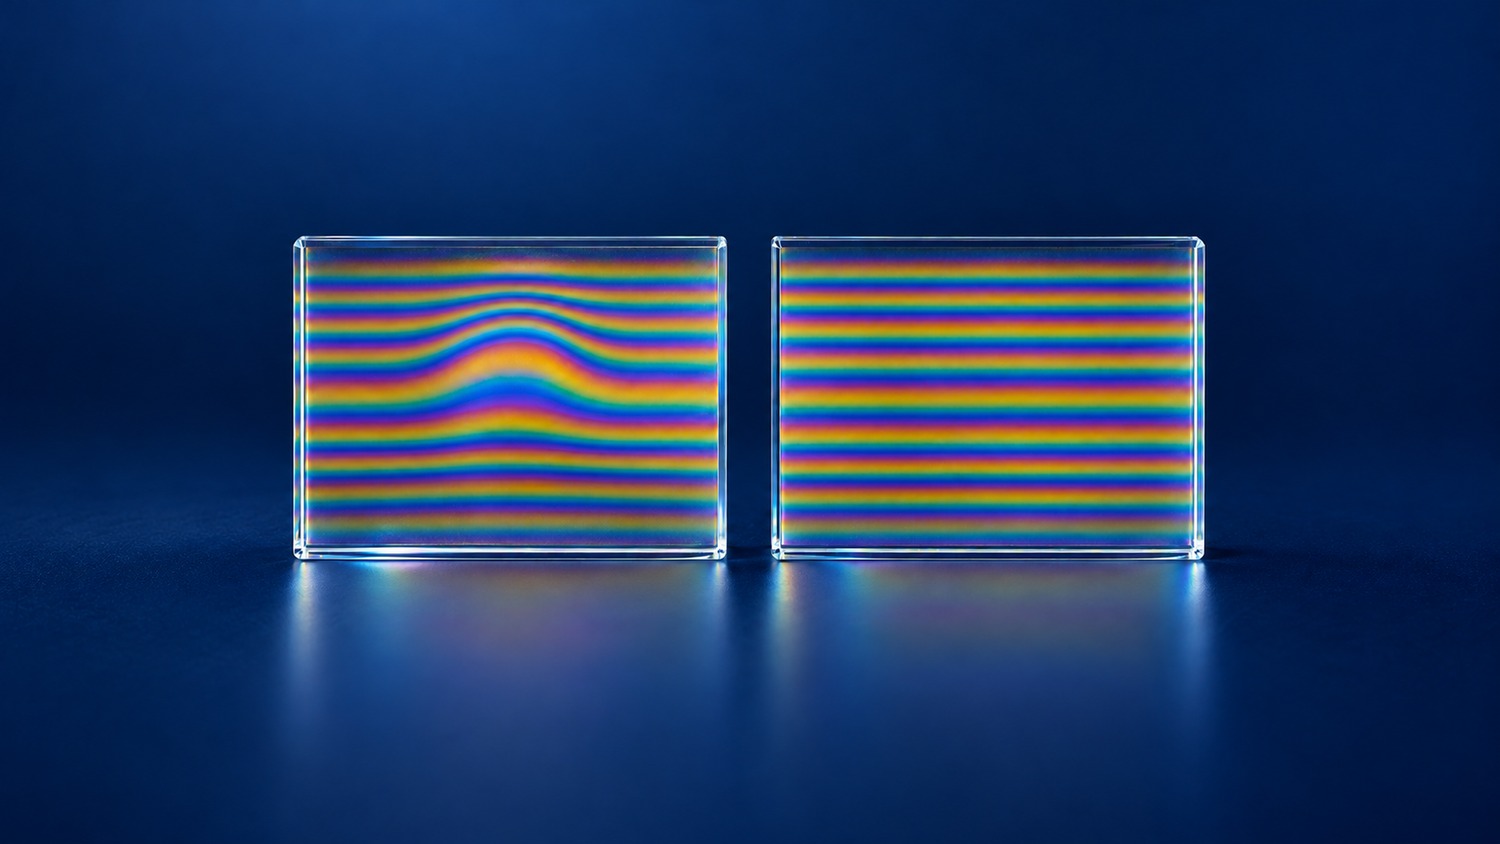
Surface figure describes departure from an ideal optical surface. For a nominally flat filter substrate, the reference is a plane. A specification in fringes is a metrology convention; it has no connection to a lens aperture setting. The useful question is how a measured departure can affect a finished filter in its working beam.
A small air wedge between a test surface and a reference flat produces equal-thickness interference fringes. As Fig. 1 shows, even a perfectly flat surface can produce many straight bands when tilt is introduced. Figure error bends those bands. Counting all visible bands therefore measures something different from reading their departure from straightness.
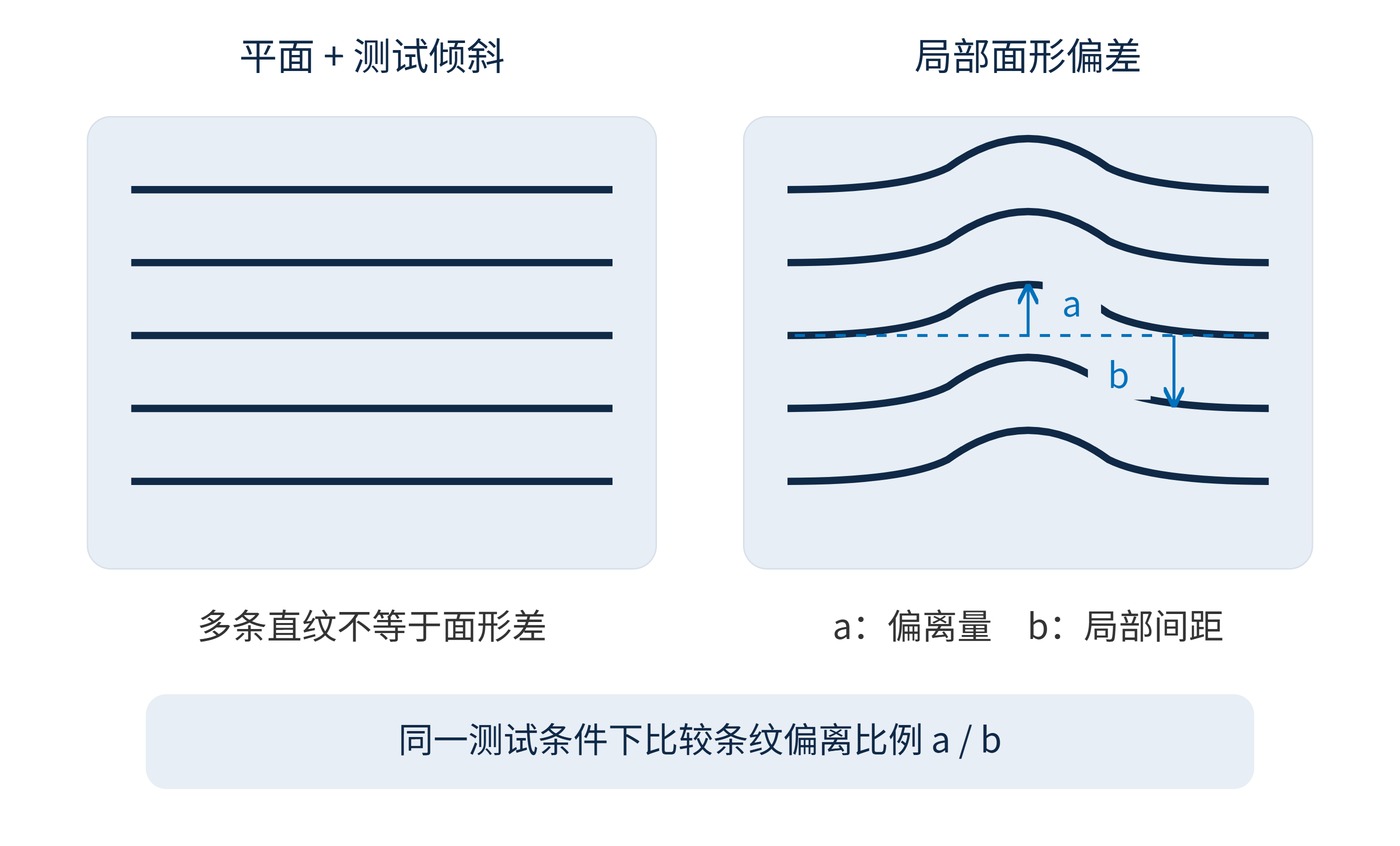
For a near-normal, single-reflection surface test across an air gap, with negligible reference error, adjacent fringes of the same type represent half a test wavelength in surface height. If a is the departure from a straight reference and b is the local spacing, the departure q gives:
$$q=\frac{a}{b},\qquad |\Delta h|\approx q\frac{\lambda_{\mathrm{test}}}{2}$$
At 632.8 nm, q = 0.2 corresponds to approximately 63.3 nm. This local reading is not automatically the peak-to-valley (PV) error over the entire aperture. Reference choice, fitting and tilt removal matter. A surface-height specification must also be distinguished from a reflected-wavefront specification.
One consequence is wavefront distortion. At near-normal reflection, a height error h produces approximately twice that error in optical path. Transmission depends on both surfaces and on the material. For a homogeneous, thin element near normal incidence, a useful simplified relationship is:
$$\Delta W_{\mathrm{R}}\approx 2h,\qquad \Delta W_{\mathrm{T}}\approx(n-1)\Delta t$$
For n = 1.50 and a thickness variation of 100 nm, the transmitted optical-path difference is approximately 50 nm. This estimate excludes oblique propagation, coating phase and index inhomogeneity. It cannot turn one surface's PV into a reliable acceptance limit for the finished element's transmitted wavefront.
A second route is a change in local surface normal and therefore angle of incidence (AOI). Fig. 2 separates these mechanisms. Two surfaces with the same PV can have different slopes if the departures occupy different lateral distances. A fringe number alone does not specify an angular distribution.
$$|\Delta\theta|\approx|\partial h/\partial x|,\qquad \lambda(\theta)\approx\lambda_0\sqrt{1-\frac{\sin^2\theta}{n_{\mathrm{eff}}^2}}$$
The slope expression describes a section along x and uses radians; the effective-index estimate assumes air outside the filter. For λ₀ = 780 nm and nₑff = 1.8, changing AOI from 0° to 1° gives an estimated blue shift of 0.037 nm. The shift from 10° to 11° is about 0.76 nm. Both the operating angle and its spread matter.
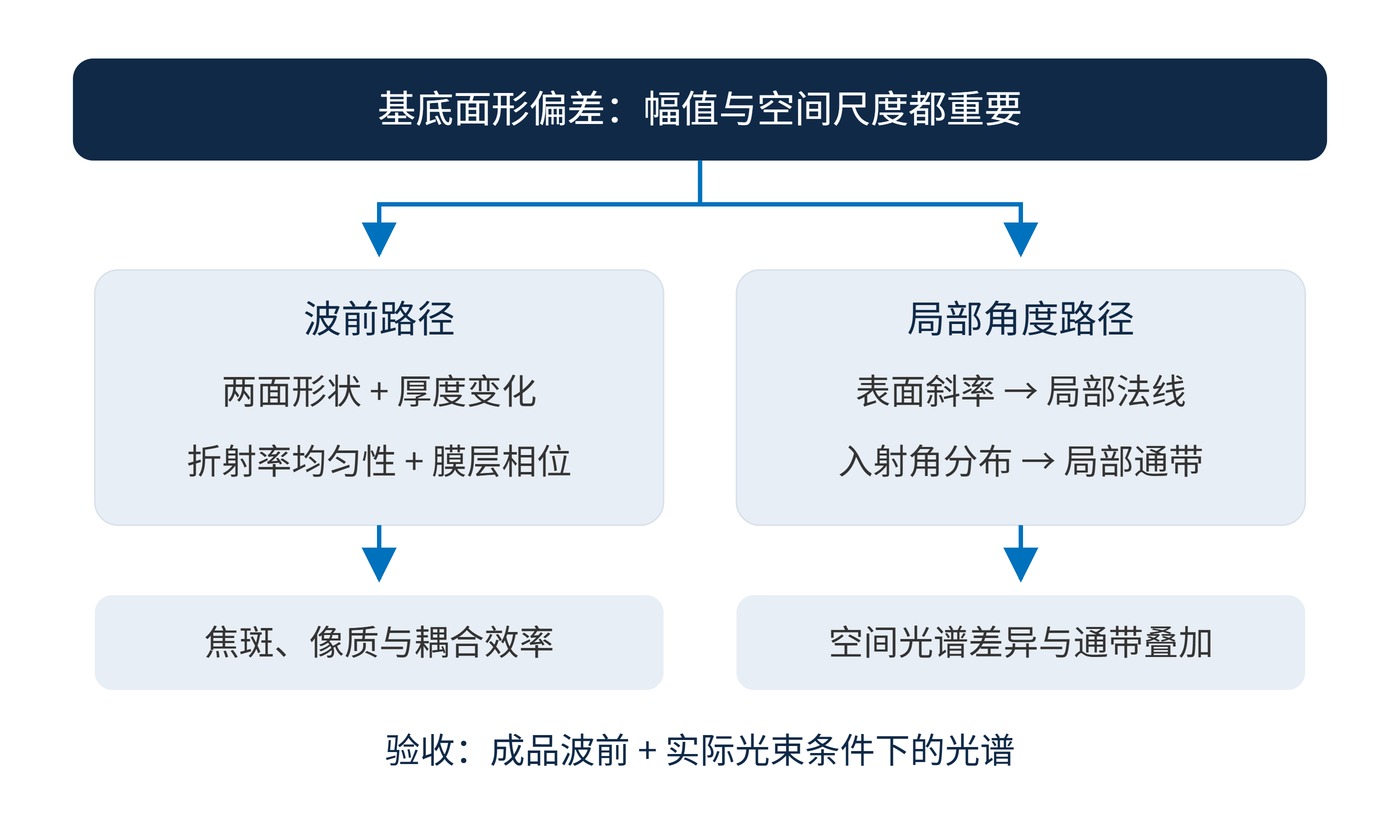
Specify the spectrum independently: for example, center wavelength (CWL) 780 nm, full width at half maximum (FWHM) 20 nm and optical density (OD) 6, with an explicit blocking interval and working beam geometry. These are illustrative requirements, not a product guarantee. Surface figure cannot substitute for spectral acceptance measurements.
| Requirement | Information to include |
|---|---|
| Figure convention | 632.8 nm test wavelength; surface or wavefront PV; overall or local departure |
| Evaluation region | For example, a 20 mm diameter clear aperture; tilt and power removal rules |
| Finished condition | After coating, at a stated temperature and support condition; mounted testing when necessary |
| System acceptance | Separate limits for transmitted wavefront, beam cone and spatially sampled spectra |
For imaging or coherent systems, allocate a wavefront budget from the required image quality or coupling efficiency. For non-imaging measurements with a large-area detector, verify passband coverage and stray-light performance before paying for a tighter figure specification.
In laser collimation and interferometry, a filter can pass its spectral test while broadening a focused spot or reducing single-mode coupling. Finished transmitted-wavefront measurements address that risk. In fluorescence imaging, sample different aperture positions and field angles to distinguish the incident beam cone from local surface-slope effects.
A narrow-linewidth source and parallel substrate can also generate parasitic multiple-beam interference. Its transmission ripple changes with angle or wavelength. This is a different phenomenon from the equal-thickness fringes used to test a surface. Remedies concern rear-surface reflection, wedge and coherence, rather than surface figure alone.
Bind every fringe value to wavelength, aperture and data-reduction rules, then close the system budget with finished-wavefront and spatial spectral measurements. For measurement conventions, refer to the surface-form tolerances defined in ISO 10110-5.
 365nm Narrow Bandpass Filter | Ø50mm | T>90%
OT-HBP3659050
365nm Narrow Bandpass Filter; FWHM 10nm; transmission >90%; blocking OD5; size Ø50mm; AOI 0°.
 450nm Narrow Bandpass Filter | Ø50mm
OT-HBP4509050
450nm Narrow Bandpass Filter; FWHM 10nm; transmission >90%; blocking OD5; size Ø50mm; AOI 0°.
 525nm Narrow Bandpass Filter | Ø50mm
OT-HBP5259050
525nm Narrow Bandpass Filter; FWHM 10nm; transmission >90%; blocking OD5; size Ø50mm; AOI 0°.
Send us your drawing and spectral targets — an engineer replies with a feasibility check and quotation within one business day.