Original content by the OOTEE Optics editorial team, drawn from first-hand production line and inspection data. Please credit the source when republishing.
Given limits in expertise and test conditions, the theories, parameters and conclusions here carry no guarantee of absolute accuracy. For technical learning and exchange only - never the sole basis for design, acceptance or selection. Corrections welcome.

Once the target wavelength is established, full width at half maximum (FWHM) is often the first useful filter design variable. Center wavelength (CWL) locates the band; FWHM determines how much neighboring spectrum accompanies the target. For a single bandpass peak, it is the separation of the two half-peak transmission crossings.
$$T(\lambda_1)=T(\lambda_2)=\frac{T_{\mathrm{peak}}}{2},\qquad \mathrm{FWHM}=\lambda_2-\lambda_1$$
“First” describes a budgeting sequence, not a universal ranking. Bandwidth sets an initial balance among useful photons, admitted background and wavelength tolerance. Wavelength coverage and blocking requirements must already be understood.
A narrow spectral line may survive a reduction in bandwidth while much of a continuous background is removed. Fig. 1 compares ideal Gaussian passbands centered at 780 nm, each with 90% peak transmission. Reducing FWHM from 40 nm to 10 nm cuts the integrated transmission to one quarter. These are calculated functions, not coating simulations or product data.
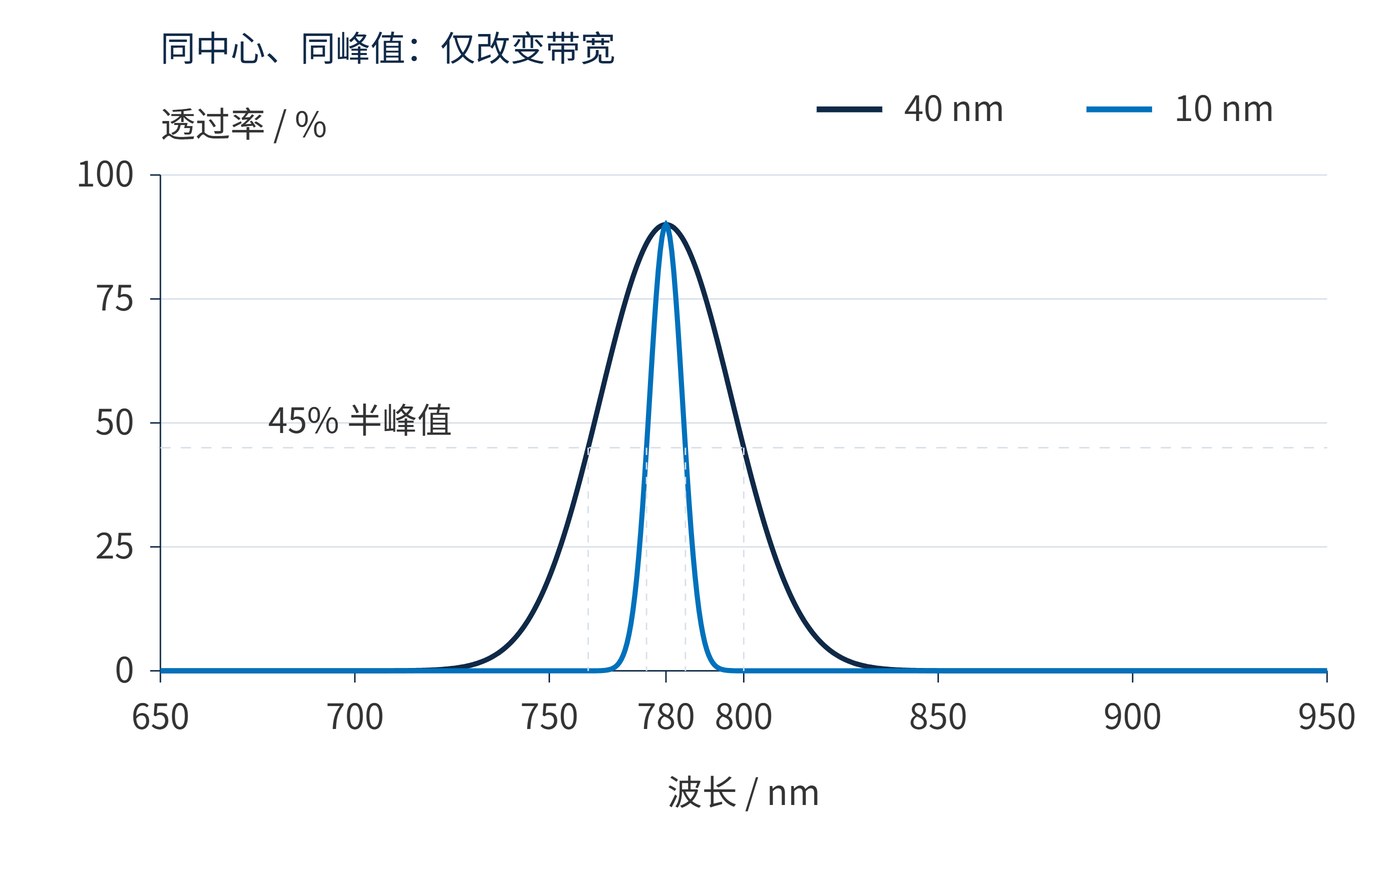
For approximately flat background and detector response across the band, the integrated curve gives a better background estimate than FWHM alone. Let $b_0$ be the unfiltered background photoelectron count per nm, including exposure time and detector response:
$$W_{\mathrm{eq}}=\frac{\int T(\lambda)\,\mathrm{d}\lambda}{T_{\mathrm{peak}}},\qquad N_{\mathrm{b}}\approx b_0T_{\mathrm{peak}}W_{\mathrm{eq}}$$
Use fractional transmission and integrate across the detector-sensitive spectrum. A Gaussian has $W_{\mathrm{eq}}\approx1.064\,\mathrm{FWHM}$. Flat tops, wings and leakage peaks change this relationship. Equal FWHM therefore does not ensure equal background.
For independent Poisson signal, background and dark counts, plus read noise, the count-domain signal-to-noise ratio is:
$$\mathrm{SNR}=\frac{N_{\mathrm{s}}}{\sqrt{N_{\mathrm{s}}+N_{\mathrm{b}}+N_{\mathrm{d}}+\sigma_{\mathrm{r}}^2}}$$
Here $N_{\mathrm{s}}$, $N_{\mathrm{b}}$ and $N_{\mathrm{d}}$ are signal, background and dark photoelectron counts; $\sigma_{\mathrm{r}}$ is total read-noise standard deviation. Quartering the background approximately doubles SNR only when background shot noise dominates and signal remains unchanged. Cutting a broad signal or operating near the read-noise floor changes the outcome.
Start with the signal's wavelength limits. Add the worst relative displacement caused by source drift, filter center tolerance, temperature and angle of incidence (AOI). As Fig. 2 shows, the resulting envelope must fit inside the band guaranteed at the required minimum transmission. The half-peak interval is not that guarantee.
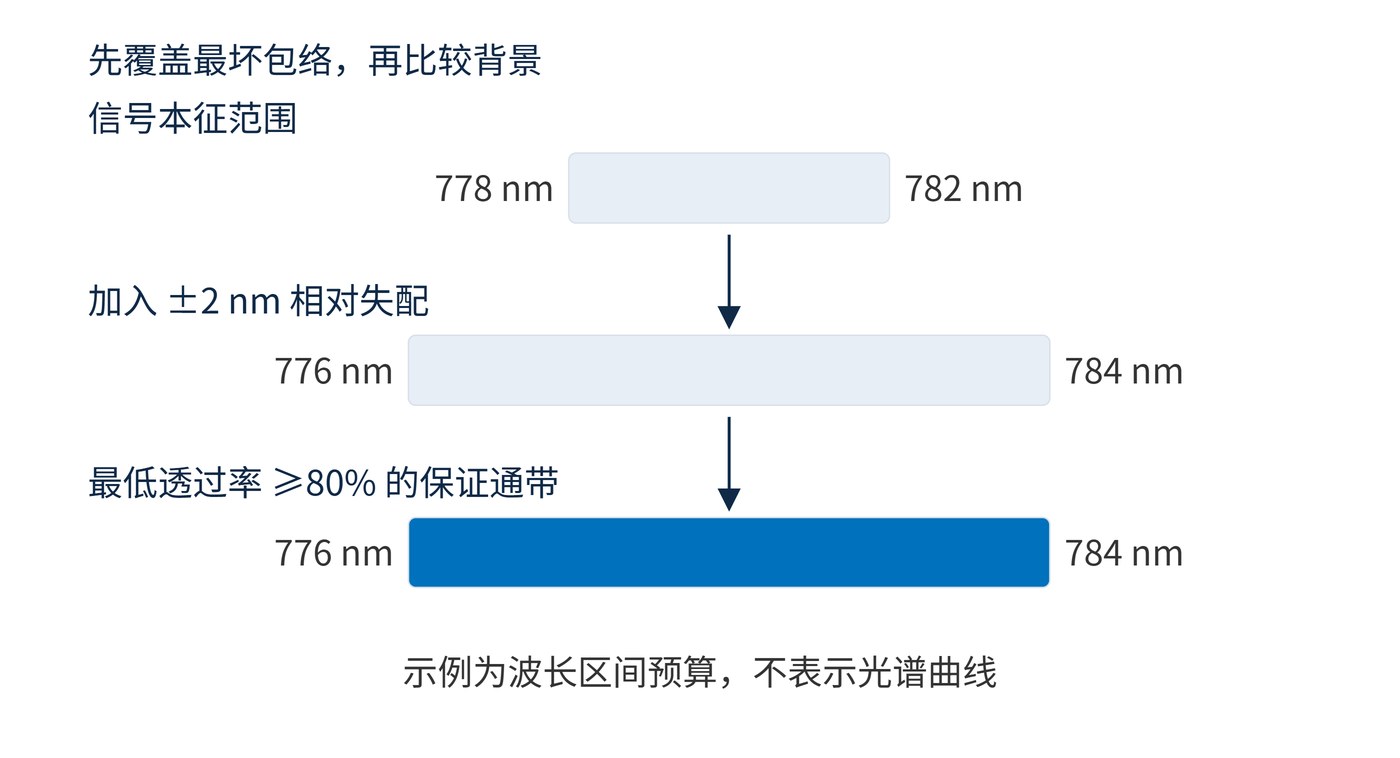
Consider a signal spanning 778–782 nm with ±2 nm worst-case relative mismatch. Transmission must be guaranteed over 776–784 nm. A 90%-peak Gaussian with 10 nm FWHM transmits only about 58% at a 4 nm offset. Increasing FWHM to 20 nm raises that value to about 81%, enough for an illustrative 80% threshold. Actual acceptance requires measured curves and tolerances.
State whether tolerances are added as worst-case bounds or combined statistically. Statistical treatment needs justified distributions and independence. Avoid counting a drift term twice, and evaluate the operating angular cone rather than substituting its average angle. A center-ray measurement may miss transmission loss elsewhere in the field.
| Budget item | Illustrative requirement | Verification |
|---|---|---|
| Useful window | ≥80% over 776–784 nm | Include worst relative mismatch |
| Center and width | CWL 780 nm; FWHM 20 nm | Specify both tolerances and measured curves |
| Blocking | OD6 over 400–750 nm and 810–1100 nm | Check detector response and transition regions |
| Reference conditions | AOI 0°; temperature 20 °C | Add operating cone and temperature limits |
Optical density (OD) specifies out-of-band attenuation: OD6 means transmission no greater than 0.0001%. It does not suppress background inside the passband. The table illustrates specification language; transition-region leakage and operating limits still need explicit requirements.
Narrower is not automatically better. Identical FWHM values can conceal different high-transmission widths, edge shapes or leakage peaks. Stronger blocking cannot compensate for background admitted within a wide passband.
Compare complete spectra under matching operating conditions. Weight transmission by the actual source, background and detector response. The acceptance criterion is retained signal and admitted background at the operating extremes, not the smallest bandwidth printed on a datasheet.
For a purchasing comparison, request the specified measurement angle, spectral resolution and wavelength sampling alongside each curve. An instrument that cannot resolve a narrow passband can distort its reported peak and width.
Technical references: optical filtering and spectral selection; research on balancing signal energy and background noise. Numerical examples use an independently calculated ideal model.
 365nm Narrow Bandpass Filter | Ø50mm | T>90%
OT-HBP3659050
365nm Narrow Bandpass Filter; FWHM 10nm; transmission >90%; blocking OD5; size Ø50mm; AOI 0°.
 450nm Narrow Bandpass Filter | Ø50mm
OT-HBP4509050
450nm Narrow Bandpass Filter; FWHM 10nm; transmission >90%; blocking OD5; size Ø50mm; AOI 0°.
 525nm Narrow Bandpass Filter | Ø50mm
OT-HBP5259050
525nm Narrow Bandpass Filter; FWHM 10nm; transmission >90%; blocking OD5; size Ø50mm; AOI 0°.
Send us your drawing and spectral targets — an engineer replies with a feasibility check and quotation within one business day.