Original content by the OOTEE Optics editorial team, drawn from first-hand production line and inspection data. Please credit the source when republishing.
Given limits in expertise and test conditions, the theories, parameters and conclusions here carry no guarantee of absolute accuracy. For technical learning and exchange only - never the sole basis for design, acceptance or selection. Corrections welcome.
A filter and detector match when the assembled optical system delivers enough useful target signal without excessive background or field clipping. A high peak transmission and a detector wavelength range that includes the target are only starting points.
Three symptoms provide useful diagnostic paths: weak target signal, background rising under bright illumination, and dark corners. Keep exposure, gain, temperature and source power fixed during comparisons; several faults may coexist.
Symptom: Installing the filter sharply reduces the target response, even though its specified peak transmission is 90%.
Cause: The center wavelength (CWL) or full width at half maximum (FWHM) excludes useful target wavelengths, or transmission falls where detector responsivity is low. Figure 1 illustrates the overlap problem. Multiplying three separate peak values is invalid. Angle of incidence (AOI) can also shift an interference filter's passband.
For a linear photodetector, neglecting other optical losses, the target photocurrent is:
$$i_{\mathrm{s}}=\int P_{\lambda,\mathrm{s}}(\lambda)T(\lambda)R(\lambda)\,\mathrm{d}\lambda$$
Here spectral power density is in $\mathrm{W/nm}$, transmission is a fraction, and responsivity is in $\mathrm{A/W}$; the result is in $\mathrm{A}$. Convert quantum efficiency to responsivity before using this equation.
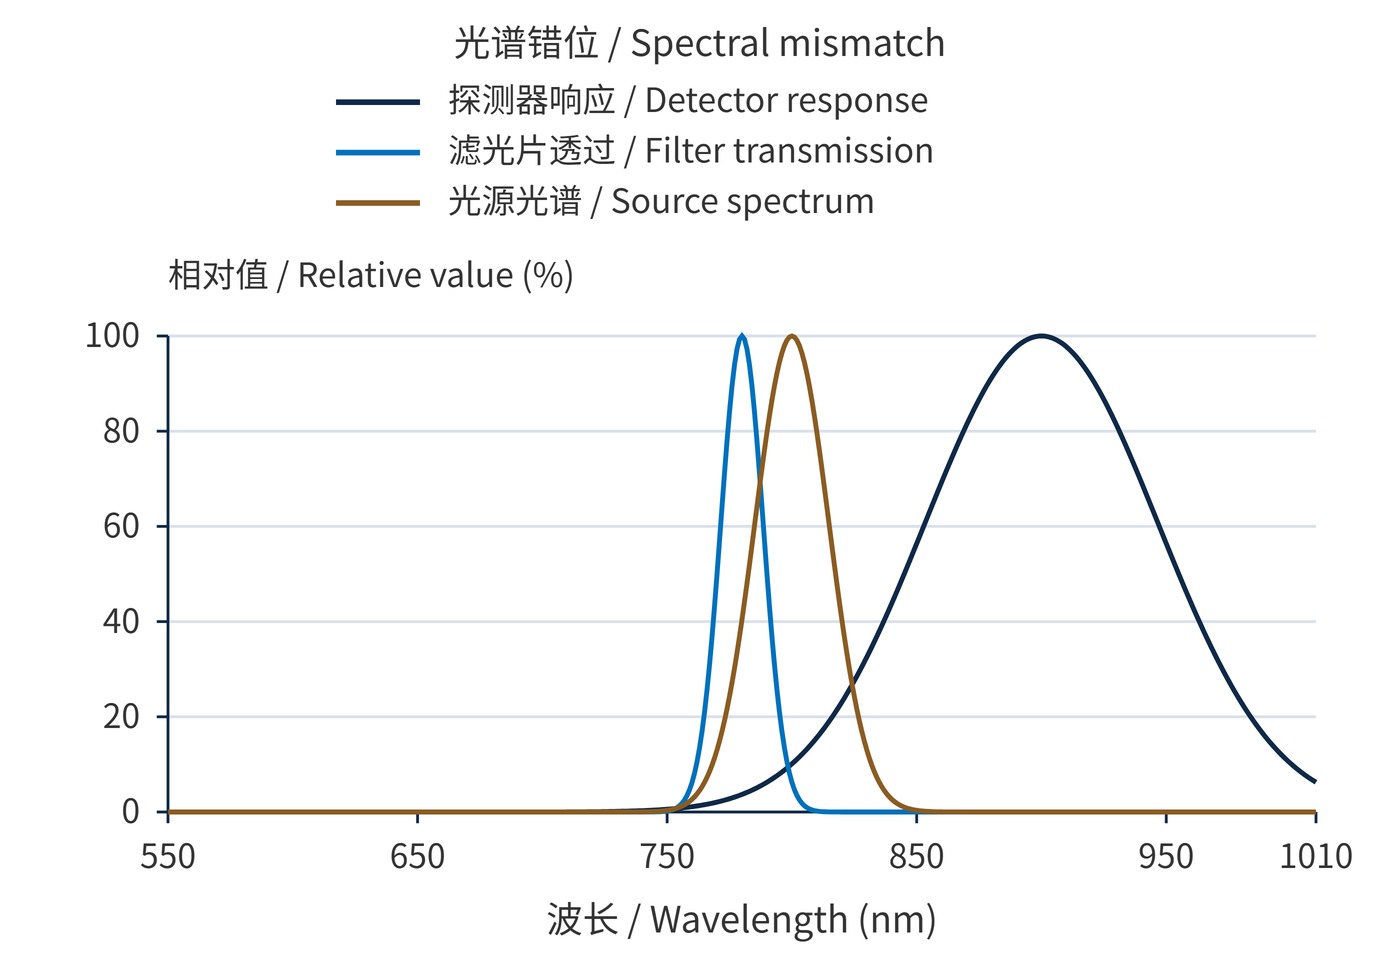
The source model peaks at 800 nm with 35 nm FWHM; the filter uses 780 nm and 20 nm; the detector model uses 900 nm and 110 nm. Separate normalization compares shapes, not absolute current.
How to verify: Integrate measured source, filter and detector data on a common wavelength grid, using the operating angle. Compare a better-aligned sample under unchanged illumination. Reduce incident power before testing without the filter to prevent saturation. Figure 1 uses mathematical models, not measured devices.
Symptom: A system works indoors but shows a higher baseline, earlier saturation and less usable dynamic range under strong ambient light.
Cause: Optical density (OD) is insufficient, or its specified wavelength range misses a region where the detector remains sensitive. Background charge consumes full-well or readout headroom and adds shot noise. Subtracting its mean does not remove that noise.
$$\mathrm{OD}(\lambda)=-\log_{10}T(\lambda),\qquad T(\lambda)=10^{-\mathrm{OD}(\lambda)}$$
For background power $10^5$ times the target power, equal responsivities and 0.9 target transmission, OD4 leaves approximately 11 times as much background signal as target signal. OD6 reduces that ratio to about 0.11. This single-background-band estimate does not replace integration of a broadband spectrum.
How to verify: Block the target while retaining ambient illumination. Increase ambient intensity in steps and record raw background and saturated pixels. Add a known filter that suppresses the suspected leakage band, and seal the mount edges. No improvement suggests in-band stray light, a bypass path or electronic offset.
Symptom: The center remains bright while corners darken; moving the filter may move the dark region.
Cause: The clear aperture clips the beam envelope at the filter plane. Outside diameter includes material hidden by bevels or retaining rings. Sensor diagonal alone does not determine the required aperture. As Figure 2 shows, an off-axis bundle may clip first.
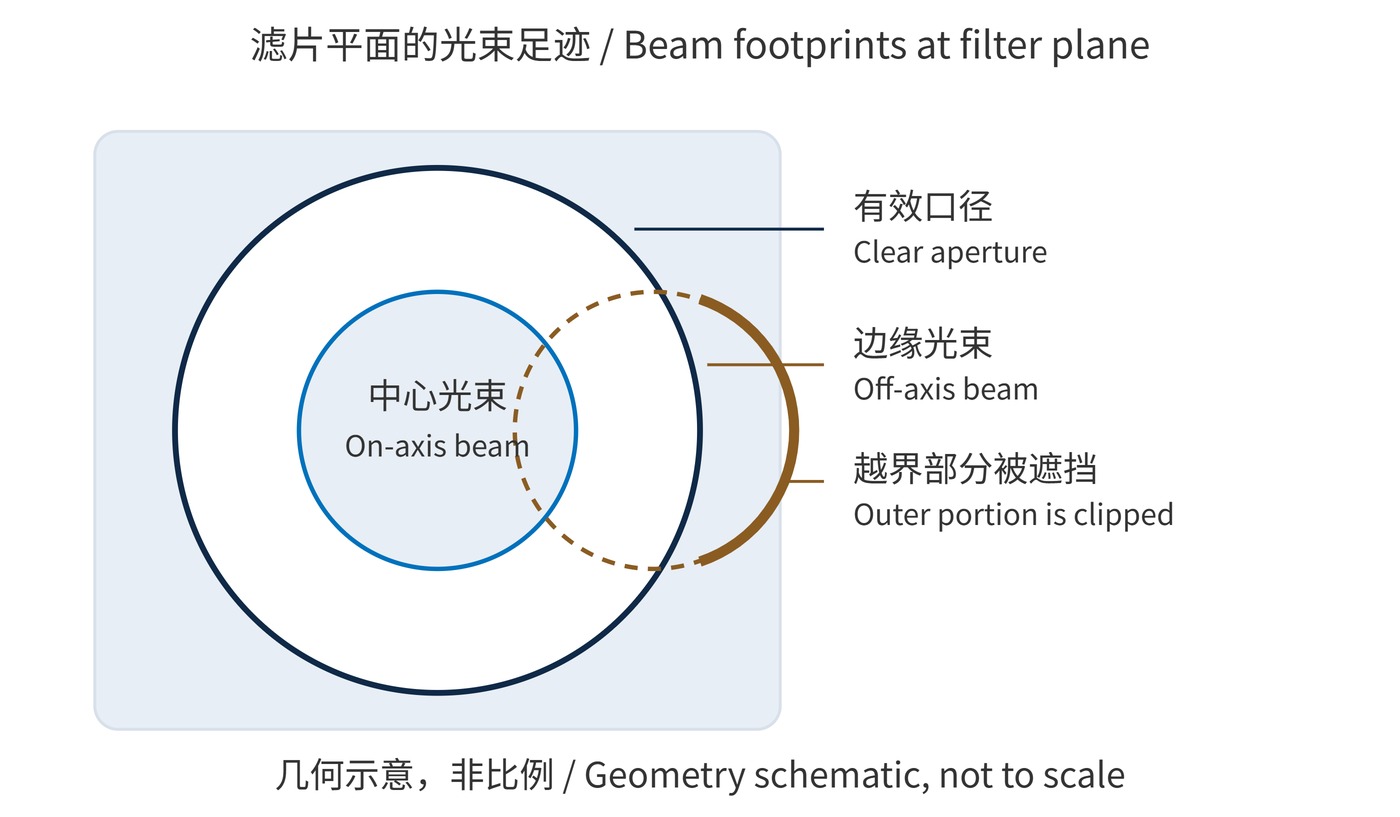
How to verify: Image a uniform diffuse field with automatic exposure and shading correction disabled. Compare normalized images with and without the filter. Move its axial position or substitute a larger aperture. Improvement supports clipping; wavelength-dependent edge loss that persists warrants checking angular spectral shifts.
Use the source and detector characteristics to choose bandwidth, then specify temperature, AOI and cone angle. These example requirements must be adapted to the system.
| Item | Example requirement | System check |
|---|---|---|
| Passband | CWL 780 nm, FWHM 20 nm, peak transmission ≥90% | Integrated target signal and source drift |
| Blocking | OD6 at 400–750 nm and 810–1100 nm | Worst expected background; agree transition regions separately |
| Geometry | Clear aperture ≥22 mm; nominal AOI 0° | Actual cone, full-field envelope and decenter |
Do not extend OD6 beyond its specified range. When evaluating narrow bandpass filters, request spectral data suitable for integration and an aperture drawing alongside peak values.
In active near-infrared imaging, measure the source-off background and source-on increment separately. Excess background points toward leakage; a weak increment calls for an overlap check. In fluorescence detection, compare excitation-on blanks with target samples to expose leakage from the much stronger excitation light.
For large sensors, full-field flat-field ratios help locate aperture problems. Change one variable at a time and retain uncorrected data so that gain compensation cannot masquerade as an optical improvement.
The three spectral peaks need not coincide: integrated signal and the noise budget are the criteria. Higher gain cannot replace missing photons. Background subtraction cannot restore saturated data, and flat-field correction cannot restore blocked edge photons. Acceptance should therefore include target signal-to-noise ratio, saturation headroom under the strongest background, and relative edge illumination.
 365nm Narrow Bandpass Filter | Ø50mm | T>90%
OT-HBP3659050
365nm Narrow Bandpass Filter; FWHM 10nm; transmission >90%; blocking OD5; size Ø50mm; AOI 0°.
 450nm Narrow Bandpass Filter | Ø50mm
OT-HBP4509050
450nm Narrow Bandpass Filter; FWHM 10nm; transmission >90%; blocking OD5; size Ø50mm; AOI 0°.
 525nm Narrow Bandpass Filter | Ø50mm
OT-HBP5259050
525nm Narrow Bandpass Filter; FWHM 10nm; transmission >90%; blocking OD5; size Ø50mm; AOI 0°.
Send us your drawing and spectral targets — an engineer replies with a feasibility check and quotation within one business day.