Original content by the OOTEE Optics editorial team, drawn from first-hand production line and inspection data. Please credit the source when republishing.
Given limits in expertise and test conditions, the theories, parameters and conclusions here carry no guarantee of absolute accuracy. For technical learning and exchange only - never the sole basis for design, acceptance or selection. Corrections welcome.
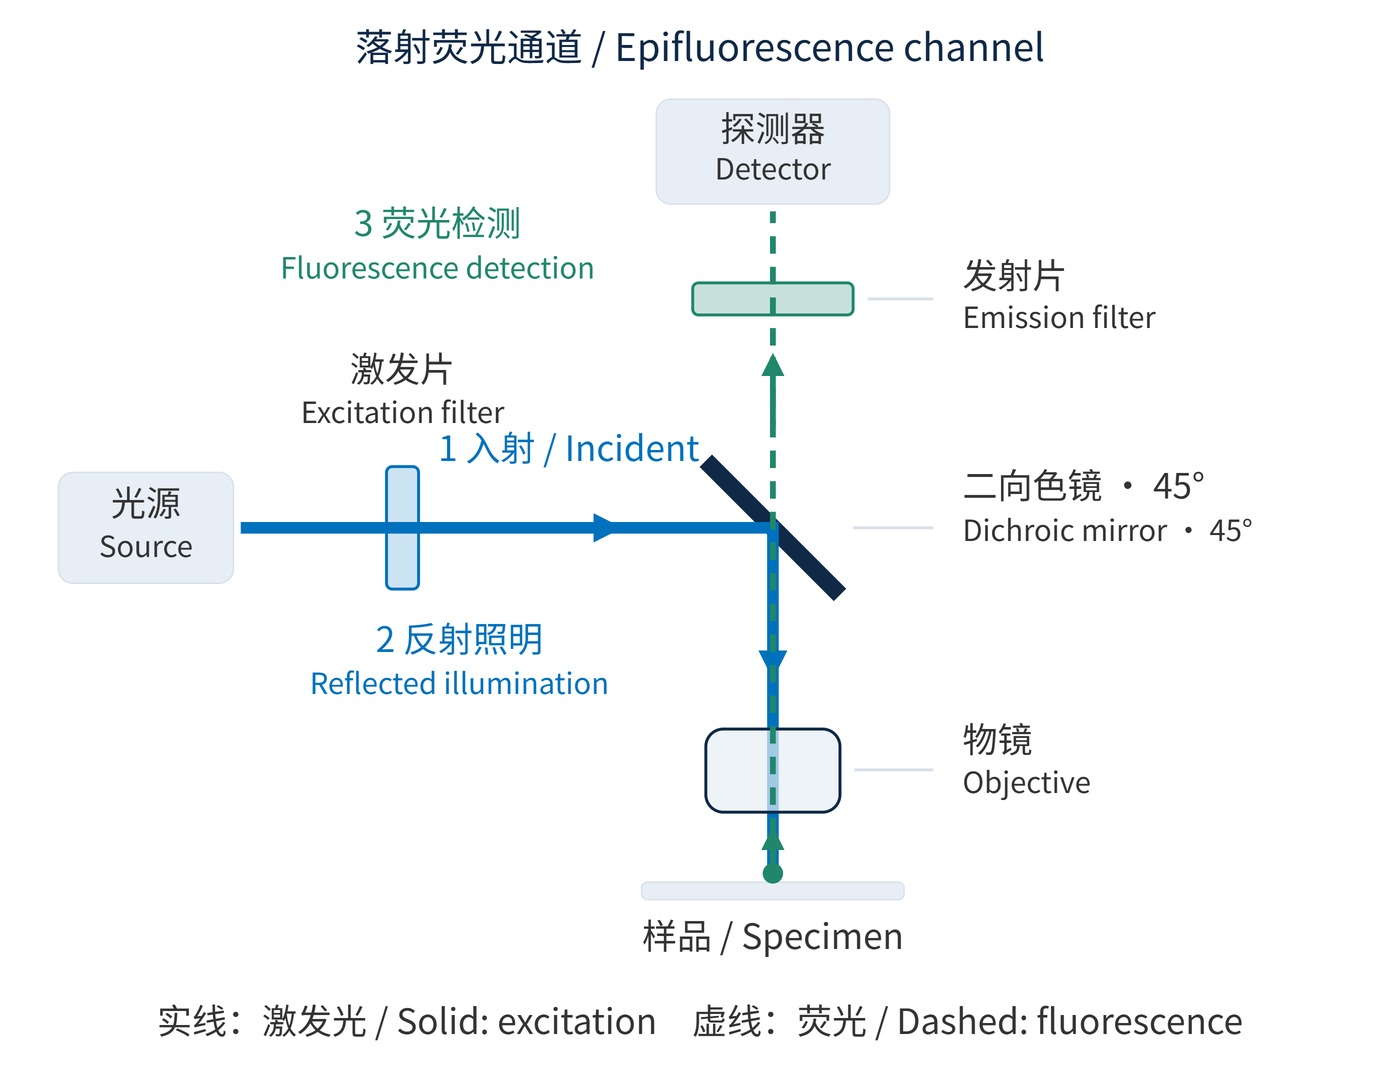
In an epifluorescence microscope, a channel is a measurement window defined jointly by the source, excitation filter, dichroic mirror, emission filter and detector. The excitation filter selects illumination; the dichroic sends it toward the objective; the emission filter selects returning fluorescence. The filter-set fundamentals explain those component roles. Here the focus is channel planning and verification on a microscope.
As Fig. 1 shows, illumination and fluorescence share the objective but separate at the dichroic. The usual shift toward longer emission wavelengths is the Stokes shift. Small shifts and overlapping emission tails force a compromise between photon collection and crosstalk.
Specify center wavelength (CWL), full width at half maximum (FWHM), optical density (OD) and angle of incidence (AOI). A starting green channel might use excitation CWL 480 nm with FWHM 30 nm, emission CWL 535 nm with FWHM 40 nm, and a dichroic transition near 505 nm. These are illustrative targets, to be revised against actual dye and source spectra.
Dichroics commonly operate at 45° AOI, while excitation and emission filters usually work near normal incidence. Request spectra for the working angle, illumination cone and both polarizations; normal-incidence curves alone do not establish the installed response. OD6 over the 465–495 nm excitation window is a possible initial emission-filter requirement; blocking must also address other source wavelengths within detector sensitivity.
$$\mathrm{OD}(\lambda)=-\log_{10}T(\lambda)$$
Here $T$ is fractional transmission: OD6 means $T=10^{-6}$. Blocking suppresses excitation leakage; it cannot reject another dye's fluorescence inside a useful passband. Separate source leakage, autofluorescence and unwanted labels when investigating background. Each calls for a different response: stronger out-of-band rejection, a lower-background measurement window, or a revised labeling and channel plan. A deeper blocking specification alone does not address all three contributions.
$$\mathrm{SNR}=\frac{N_{\mathrm{s}}}{\sqrt{N_{\mathrm{s}}+N_{\mathrm{b}}+n_{\mathrm{pix}}\sigma_{\mathrm{r}}^2}}$$
This approximation assumes shot noise and independent read noise dominate. $N_{\mathrm{s}}$ and $N_{\mathrm{b}}$ are mean signal and background photoelectron counts over the measurement region, including dark-current background; $n_{\mathrm{pix}}$ is the pixel count and $\sigma_{\mathrm{r}}$ the per-pixel read noise. Narrowing detection improves the signal-to-noise ratio only when background rejection outweighs lost signal.
Overlay excitation and emission spectra with source output and detector quantum efficiency. Fig. 2 places example windows on one wavelength scale. These windows are neither complete dye spectra nor guaranteed purchasing specifications: fixation, solvent and binding conditions can alter spectral behavior.
| Labeling approach | Excitation window | Emission window | First check |
|---|---|---|---|
| DAPI nuclear stain | 350–380 nm | 435–485 nm | UV illumination and objective transmission |
| FITC green label | 465–495 nm | 515–555 nm | Green background and leakage into red detection |
| TRITC orange-red label | 535–555 nm | 580–620 nm | Cross-excitation of other labels |
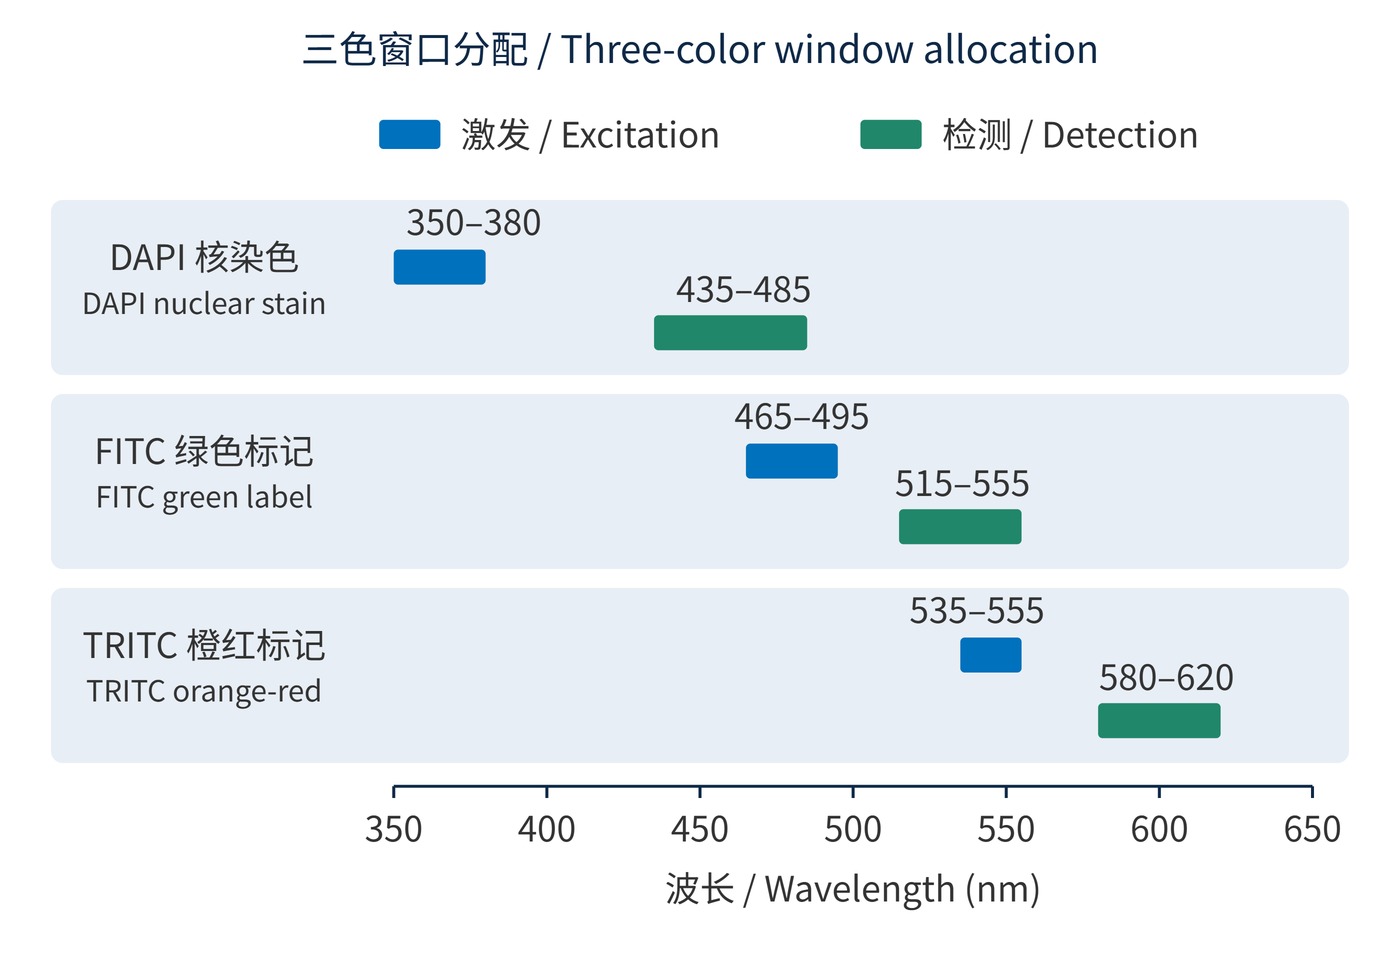
The FITC emission window overlaps TRITC excitation in Fig. 2. Simultaneous illumination therefore needs joint optimization of multiband filters and dichroic reflection/transmission regions. A shared optical element cannot independently provide high reflection and high transmission for the same wavelength, polarization and ray direction. Combining independent single-color designs may fail. Narrower windows, different labels or sequential excitation can resolve conflicts.
Nuclear staining with two protein labels on fixed sections often permits sequential acquisition. This reduces cross-excitation but does not remove emission bleed-through under the active illumination. Fast live-cell imaging may require simultaneous detection with separate sensors or camera regions. A multiband set in front of one monochrome sensor simply combines the transmitted signals unless another mechanism separates them.
Simultaneous branches need their own splitting boundaries and emission filters, plus checks of registration and exposure response. A small tail from a bright label can overwhelm a weak one; assign the weaker label a low-background window with good detection efficiency. Evaluate contamination relative to that weak signal, rather than relying on a visually clean merged image. Single-label controls are essential for identifying this contamination, as discussed in microscopy method validation.
 365nm Narrow Bandpass Filter | Ø50mm | T>90%
OT-HBP3659050
365nm Narrow Bandpass Filter; FWHM 10nm; transmission >90%; blocking OD5; size Ø50mm; AOI 0°.
 450nm Narrow Bandpass Filter | Ø50mm
OT-HBP4509050
450nm Narrow Bandpass Filter; FWHM 10nm; transmission >90%; blocking OD5; size Ø50mm; AOI 0°.
 525nm Narrow Bandpass Filter | Ø50mm
OT-HBP5259050
525nm Narrow Bandpass Filter; FWHM 10nm; transmission >90%; blocking OD5; size Ø50mm; AOI 0°.
Send us your drawing and spectral targets — an engineer replies with a feasibility check and quotation within one business day.