Original content by the OOTEE Optics editorial team, drawn from first-hand production line and inspection data. Please credit the source when republishing.
Given limits in expertise and test conditions, the theories, parameters and conclusions here carry no guarantee of absolute accuracy. For technical learning and exchange only - never the sole basis for design, acceptance or selection. Corrections welcome.
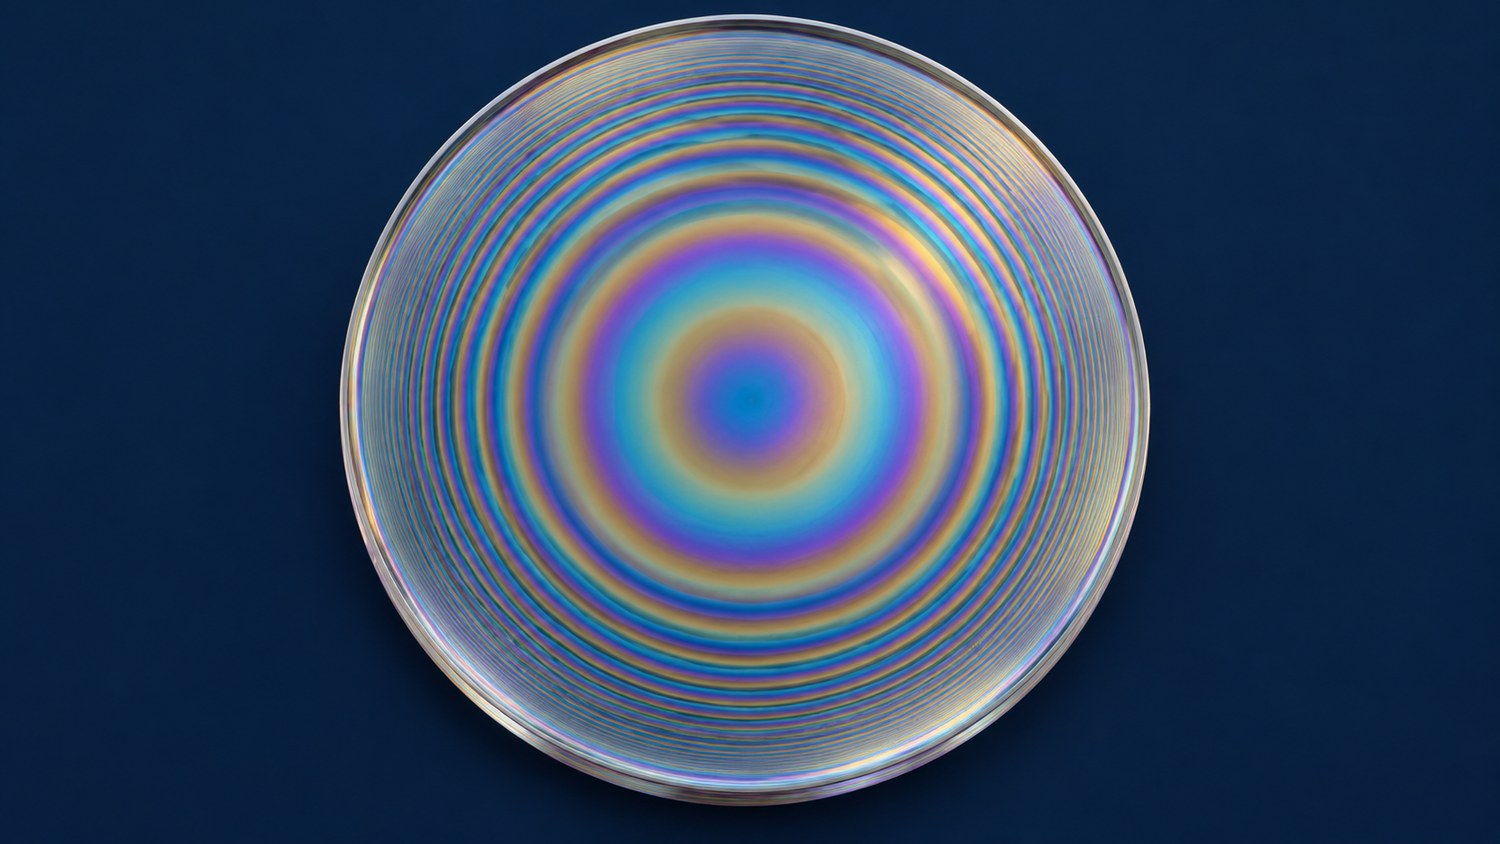
A large filter must deliver its specified spectrum wherever the system uses the glass. Center wavelength (CWL), full width at half maximum (FWHM), peak transmission and optical density (OD) can vary with position. Angle of incidence (AOI) and temperature introduce additional changes. There is no universal diameter at which a filter becomes “large”: aperture, bandwidth and the beam footprint determine the difficulty together.
The practical question is how to qualify the delivered aperture. A passing center measurement or aperture average does not establish that every region passes. Small radial thickness changes translate into the wavelength spread described below; they are normally invisible to the eye and only show up in point-by-point measurements, which is exactly why the average is not an acceptance criterion.
When all layer optical thicknesses change by approximately the same fraction, with refractive indices, angle and temperature otherwise fixed, the local wavelength scale changes approximately as follows:
$$\frac{\delta\lambda_{\mathrm{CWL}}}{\lambda_{\mathrm{CWL}}}\approx\frac{\delta(nd)}{nd}$$
At CWL 780 nm, a 0.1% common optical-thickness change produces about 0.78 nm of wavelength shift. That consumes a much larger fraction of a 2 nm passband than of a 20 nm passband. Independent layer errors can also change shape, peak transmission and blocking; shifting a center spectrum cannot reproduce those effects.
For measurements made under identical conditions, wavelength nonuniformity can be expressed as a peak-to-valley range:
$$U_{\lambda,\mathrm{PV}}=\max_i\lambda_{\mathrm{CWL},i}-\min_i\lambda_{\mathrm{CWL},i}$$
This result is in nm. A percentage needs an explicit reference wavelength. A small range does not guarantee correct targeting: all positions could share the same offset. Minimum peak transmission, maximum bandwidth and weakest blocking therefore need separate checks.
As Fig. 1 shows, sampling should cover azimuth as well as radius. Concentric rings suggest radial symmetry, but a real aperture may also contain sector errors, fixture shadows or local defects.
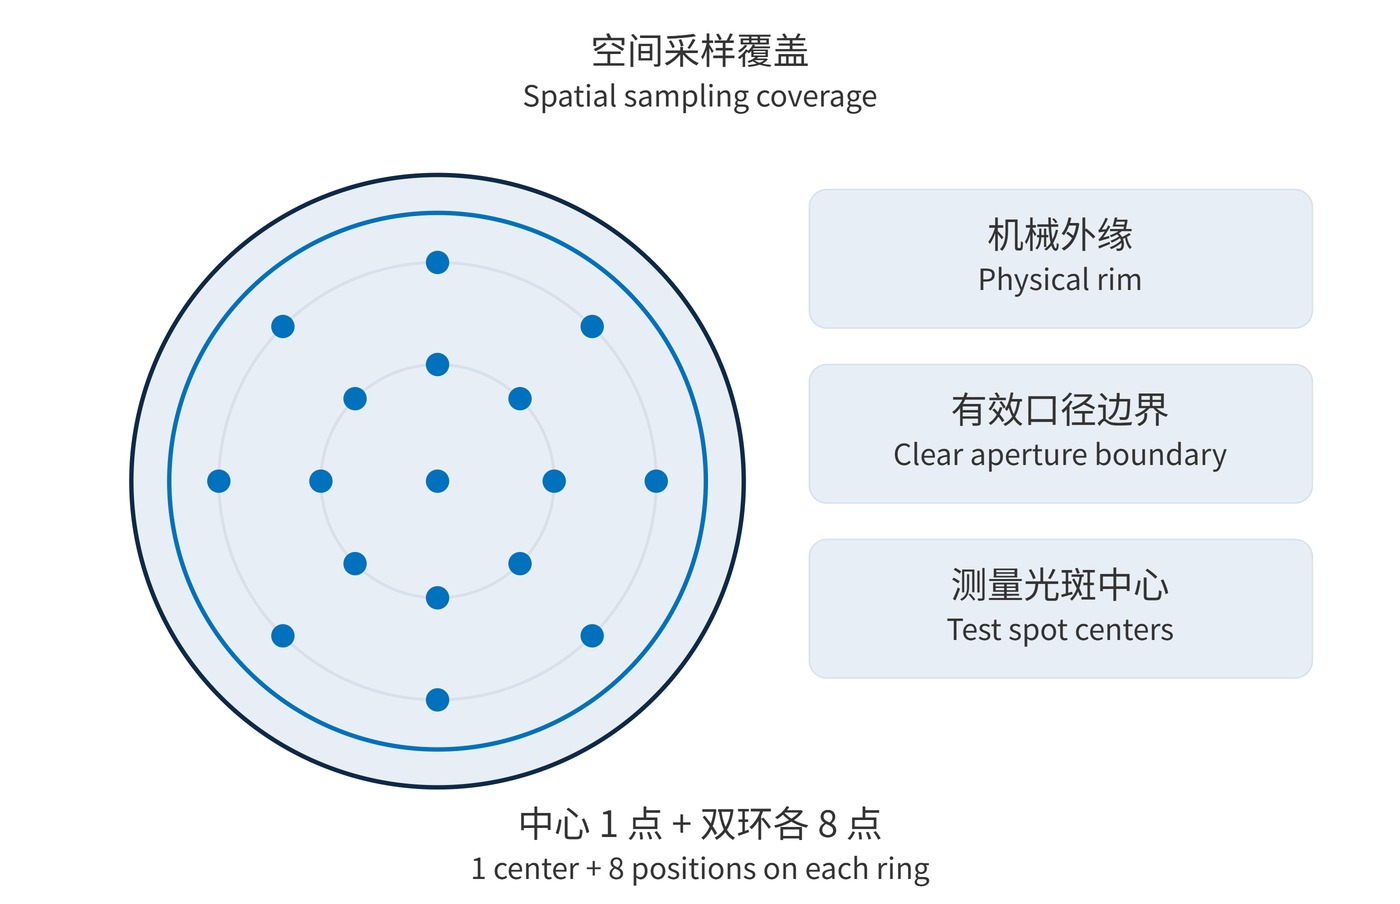
Specify the clear aperture separately from the outside diameter. For example, a 150 mm disk might require a 135 mm circular clear aperture centered on a mechanical datum. A rectangular field or an unusual beam footprint needs its own drawing.
The following values are a specification example, not a product guarantee. A request for narrow bandpass filters should also include source linewidth, operating angles and the aperture drawing.
| Item | Example requirement | Acceptance meaning |
|---|---|---|
| Local passband | CWL 780 ± 1 nm; FWHM 20 ± 2 nm | Every agreed location passes |
| Spatial variation | CWL peak-to-valley ≤ 1 nm | Separate from target accuracy |
| Transmission and blocking | Peak ≥ 90%; OD ≥ 6 over 400–700 nm | Check worst location and detection floor |
| Test conditions | AOI 0°; 23 ± 2 °C; 3 mm beam diameter | Also agree angular spread and spectral resolution |
A starting plan could use one center location plus eight azimuths at each of two radii: 17 locations in total. Add measurements where risk warrants them. This is not a universal standard and cannot exclude defects between samples. Keep the complete test spot inside the clear aperture, moving outer locations inward by at least the spot radius. A large spot hides local variation through averaging; a small spot makes alignment and signal quality more demanding.
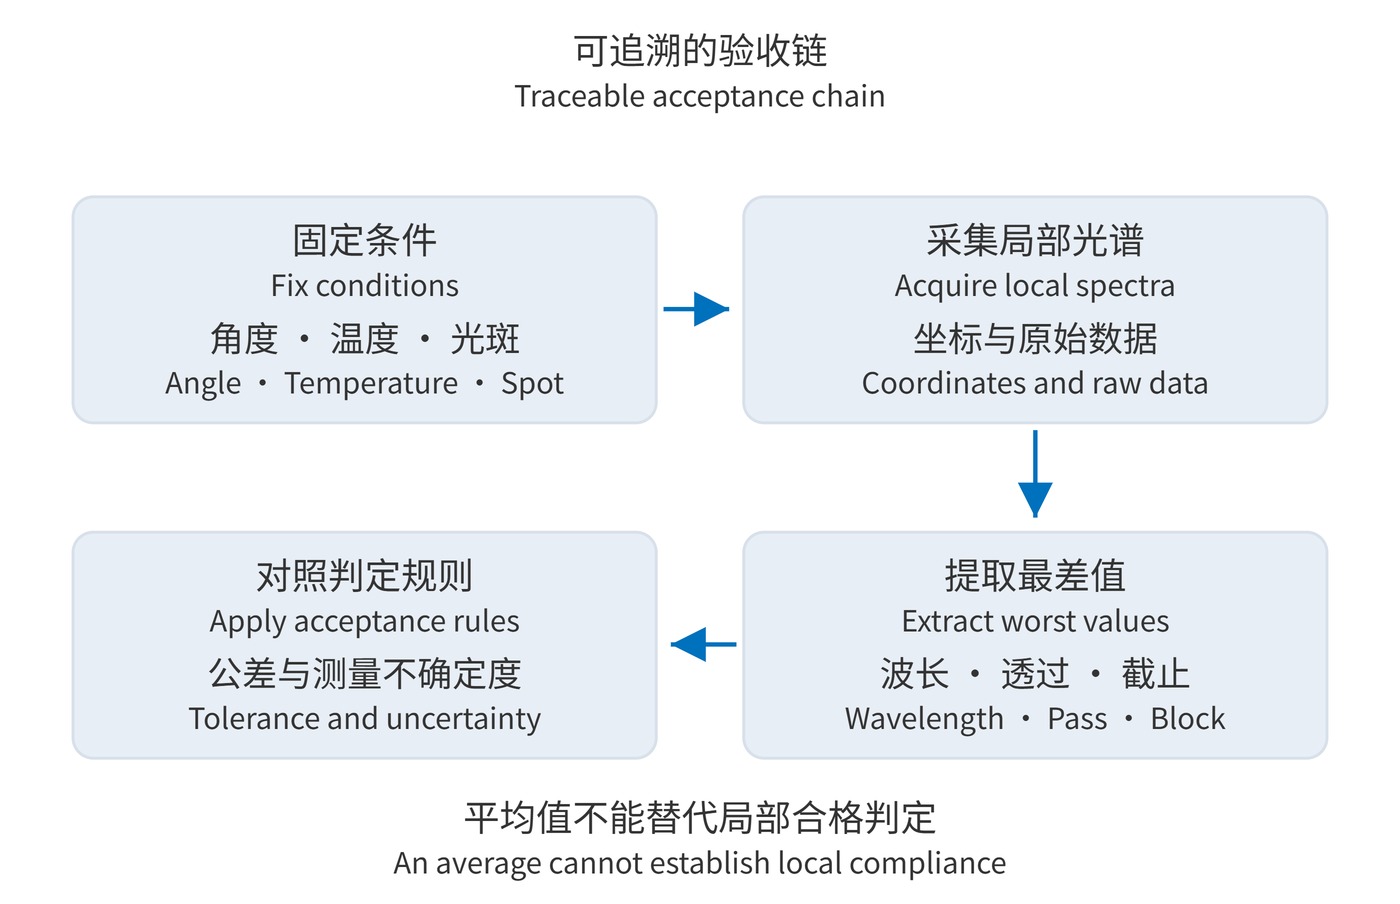
Fig. 2 outlines the evidence chain. Retain coordinates, local spectra and conditions before reporting statistics. OD6 means 0.0001% transmission. Stray light or insufficient instrument range may allow only a lower-bound result. Wavelength uncertainty also belongs in the acceptance decision; display digits do not establish accuracy.
In wide-field fluorescence and machine vision, different fields may encounter different positions and incidence angles. A local spectral shift can appear as signal or background shading. Flat-field correction cannot recover wavelengths already rejected by the filter. Check the field edge under its actual angular distribution.
For a receiver that sums powers from different regions, assuming incoherent intensity addition and negligible spatial coupling, effective transmission is an illumination-weighted average:
$$T_{\mathrm{eff}}(\lambda)=\frac{\sum_i w_iT_i(\lambda)}{\sum_i w_i}$$
Here $w_i$ is incident power in the corresponding region. A center-weighted beam and uniform illumination need not produce the same result. Equal sample counts are not automatically equal area weights. Coherent imaging additionally requires phase and transmitted-wavefront assessment.
A useful acceptance record identifies the aperture, conditions, sampling coordinates, local spectra and worst values. It establishes the limits of the evidence and preserves a spatial reference for later system verification.
 365nm Narrow Bandpass Filter | Ø50mm | T>90%
OT-HBP3659050
365nm Narrow Bandpass Filter; FWHM 10nm; transmission >90%; blocking OD5; size Ø50mm; AOI 0°.
 450nm Narrow Bandpass Filter | Ø50mm
OT-HBP4509050
450nm Narrow Bandpass Filter; FWHM 10nm; transmission >90%; blocking OD5; size Ø50mm; AOI 0°.
 525nm Narrow Bandpass Filter | Ø50mm
OT-HBP5259050
525nm Narrow Bandpass Filter; FWHM 10nm; transmission >90%; blocking OD5; size Ø50mm; AOI 0°.
Send us your drawing and spectral targets — an engineer replies with a feasibility check and quotation within one business day.