Original content by the OOTEE Optics editorial team, drawn from first-hand production line and inspection data. Please credit the source when republishing.
Given limits in expertise and test conditions, the theories, parameters and conclusions here carry no guarantee of absolute accuracy. For technical learning and exchange only - never the sole basis for design, acceptance or selection. Corrections welcome.
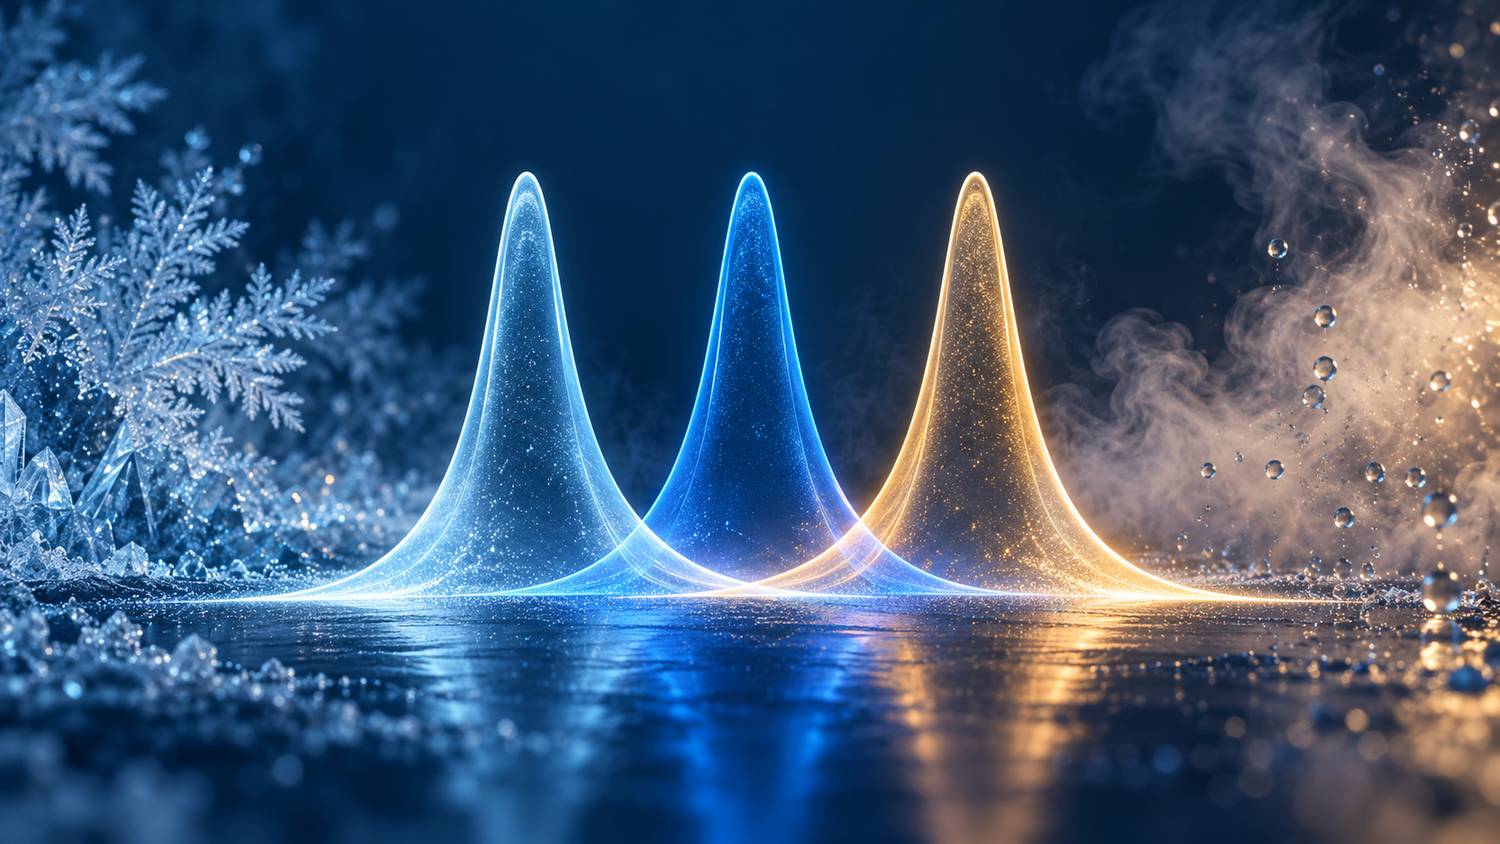
A filter does not have one universal transmission temperature coefficient. Specify the wavelength, temperature interval, humidity and measured quantity. Center wavelength (CWL) drift is expressed in nm/°C; transmission at a fixed wavelength may instead change in percentage points/°C or as a relative rate per °C. These quantities answer different questions.
Humidity stability describes spectral changes during exposure and any changes remaining after recovery. A useful record includes full width at half maximum (FWHM), peak transmission, transmission at the signal wavelength and optical density (OD), as well as CWL.
Temperature affects refractive index, layer thickness and mechanical constraint. Even when a passband simply translates without losing height, a stationary laser line samples a different part of it. Let $\vartheta$ denote temperature and $T$ transmittance, with all other test conditions held constant.
$$k_\lambda=\frac{\partial\lambda_{\mathrm{CWL}}}{\partial\vartheta},\qquad \beta_T(\lambda)=\frac{1}{T(\lambda)}\frac{\partial T(\lambda)}{\partial\vartheta}$$
The units are $\mathrm{nm/^{\circ}C}$ and $\mathrm{^{\circ}C^{-1}}$, respectively. A change from 90% to 89% is a loss of 1 percentage point, or approximately 1.11% relative to the initial value. State the convention explicitly. Relative coefficients become unhelpful near zero transmission.
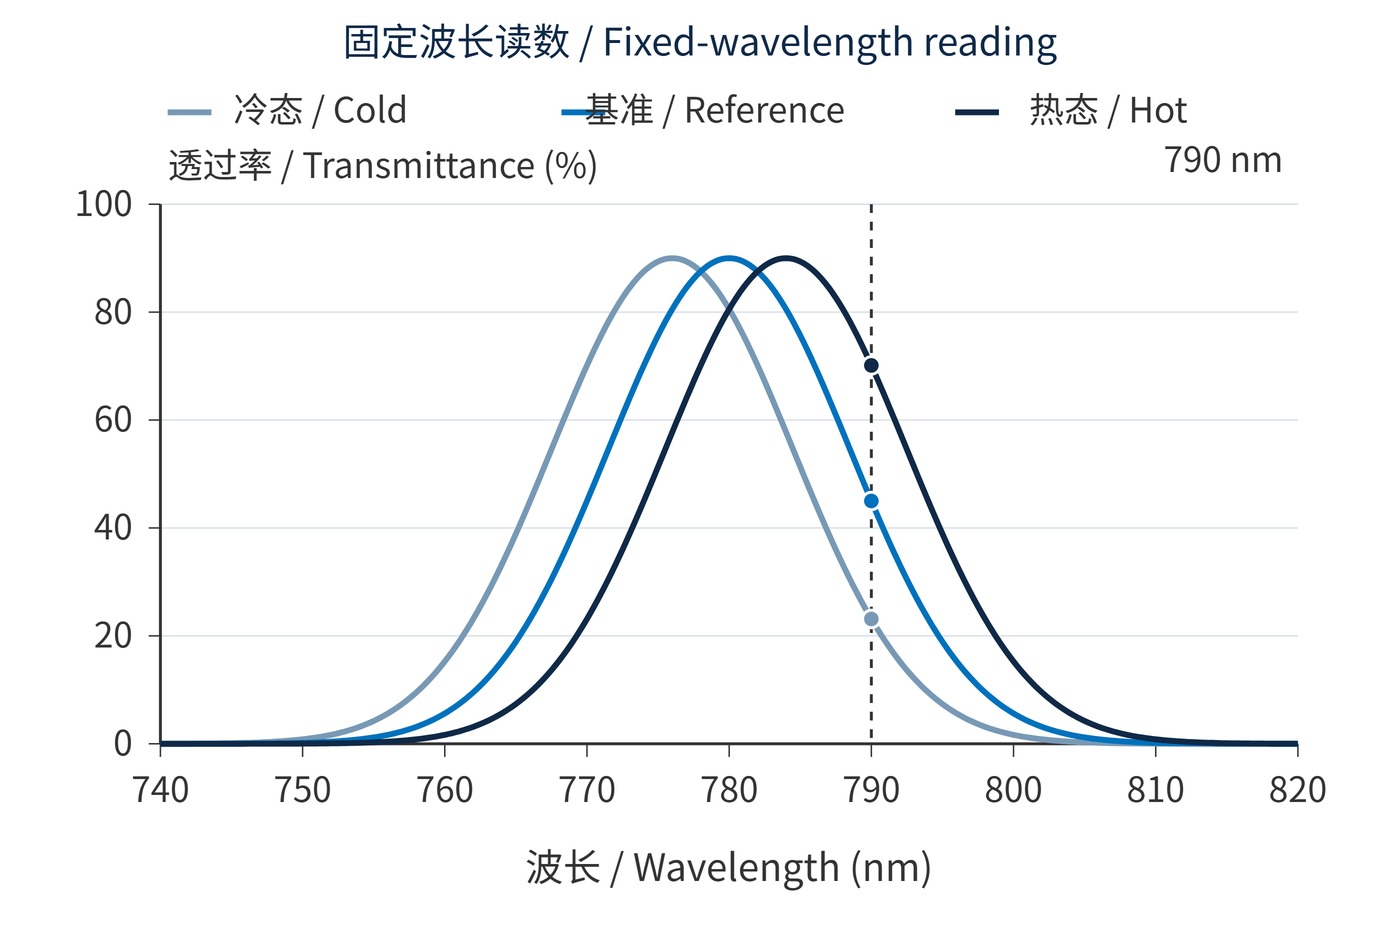
$$\left.\frac{\partial T}{\partial\vartheta}\right|_\lambda\approx-k_\lambda\frac{\partial T}{\partial\lambda}$$
This approximation assumes a rigid spectral translation. Fig. 1 illustrates why a signal on a steep edge is sensitive to drift. A near-zero slope at the peak only describes local behavior, not stability across an entire temperature range. The hypothetical displacement is exaggerated for visibility.
Moisture entering porous layers can change effective optical thickness. Condensation adds a separate scattering mechanism, while seals, adhesives and mounting stress can also affect results. A single humidity coefficient cannot describe all these effects; the discussion of humidity requirements explains the moisture pathways.
Consider a requirement of CWL 780 nm, FWHM 20 nm and OD6 blocking. Define the blocking interval and the minimum transmission at the 780 nm signal wavelength. Fix the angle of incidence (AOI), for example 0°, along with beam cone and mounting. Comparing scans made at different angles cannot establish a thermal coefficient.
A protocol might scan the passband and specified blocking bands at −20 °C, 23 °C and 60 °C after sample temperature has stabilized, on both heating and cooling. The humidity sequence below is an illustrative agreement, not a universal qualification. ISO 9022-2 covers cold, heat and humidity test methods; severity and acceptance limits still need definition.
| Stage | Example condition | Record or compare |
|---|---|---|
| Baseline | 23 °C, 50% RH | Full spectrum and uncertainty |
| Exposure | 40 °C, 90% RH, 48 h, no condensation | Environmental log; in-situ spectra if required |
| Recovery | 23 °C, 50% RH, 24 h | CWL, FWHM, transmission, OD and appearance |
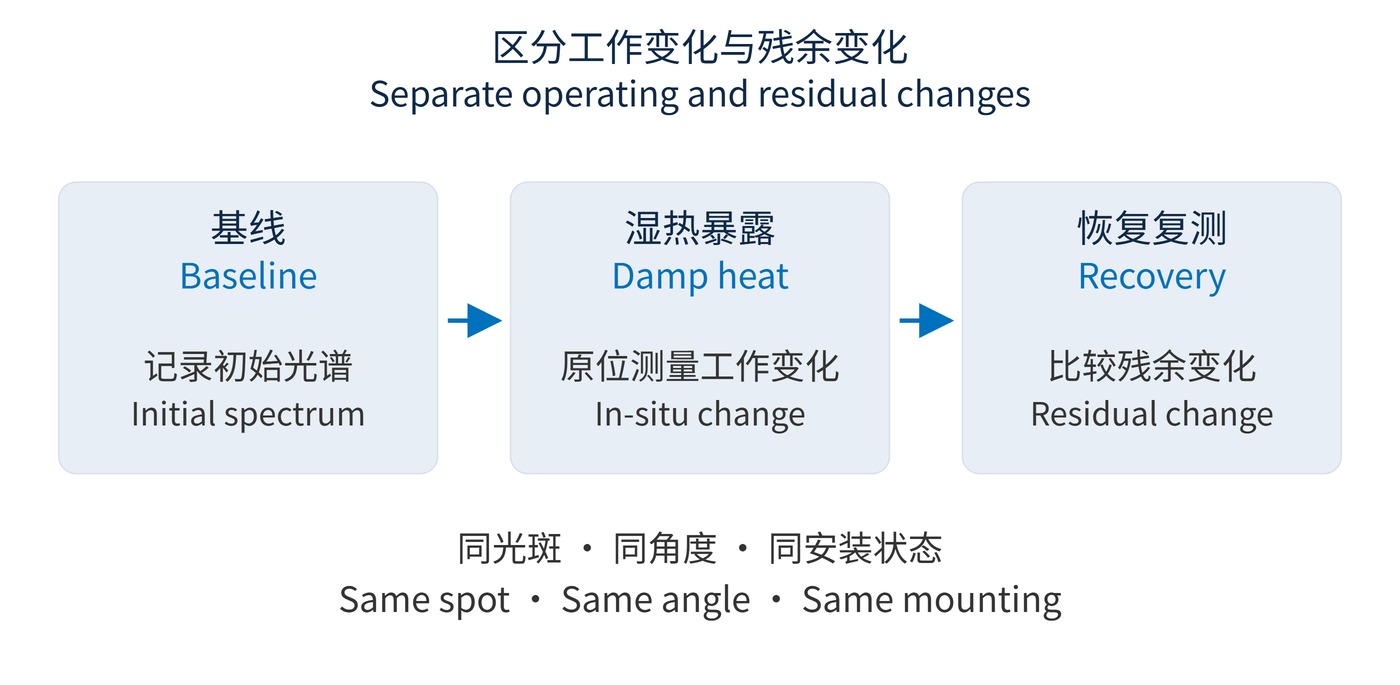
Fig. 2 separates performance during exposure from the residual change after recovery. A room-condition retest does not establish transmission in damp heat. Keep beam position, orientation, clamping and instrument settings consistent, and document the actual recovery interval.
Agree on limits before testing: allowed CWL displacement, bandwidth change, signal transmission loss and blocking leakage. Compare each result with its own baseline rather than averaging away a weak sample. Record whether the exposure was applied to a loose optic or the mounted assembly, since the mounting boundary can change thermal behavior. If heating and cooling give different readings at the same temperature, report both branches instead of reducing them to one coefficient. A single recovered spectrum can establish a residual change at that time; it cannot reveal the recovery rate without intermediate measurements.
Outdoor narrow-line receivers need a combined budget for source drift, filter drift and mounting angle. When evaluating narrow bandpass filters, use the minimum signal-wavelength transmission across operating conditions, rather than the room-temperature peak alone.
For broadband fluorescence, estimate collected flux using the emission spectrum and detector response as weighting factors. On humid inspection lines, distinguish condensation from moisture uptake: surface drying may remove the former quickly, whereas recovery from the latter depends on construction and exposure history.
Report environmental history, spectral differences and measurement uncertainty together. OD6 verification also requires adequate dynamic range and stray-light control. Report a detection limit when leakage falls below instrument capability; stability claims require changes that can be distinguished from measurement uncertainty.
 365nm Narrow Bandpass Filter | Ø50mm | T>90%
OT-HBP3659050
365nm Narrow Bandpass Filter; FWHM 10nm; transmission >90%; blocking OD5; size Ø50mm; AOI 0°.
 450nm Narrow Bandpass Filter | Ø50mm
OT-HBP4509050
450nm Narrow Bandpass Filter; FWHM 10nm; transmission >90%; blocking OD5; size Ø50mm; AOI 0°.
 525nm Narrow Bandpass Filter | Ø50mm
OT-HBP5259050
525nm Narrow Bandpass Filter; FWHM 10nm; transmission >90%; blocking OD5; size Ø50mm; AOI 0°.
Send us your drawing and spectral targets — an engineer replies with a feasibility check and quotation within one business day.