Original content by the OOTEE Optics editorial team, drawn from first-hand production line and inspection data. Please credit the source when republishing.
Given limits in expertise and test conditions, the theories, parameters and conclusions here carry no guarantee of absolute accuracy. For technical learning and exchange only - never the sole basis for design, acceptance or selection. Corrections welcome.
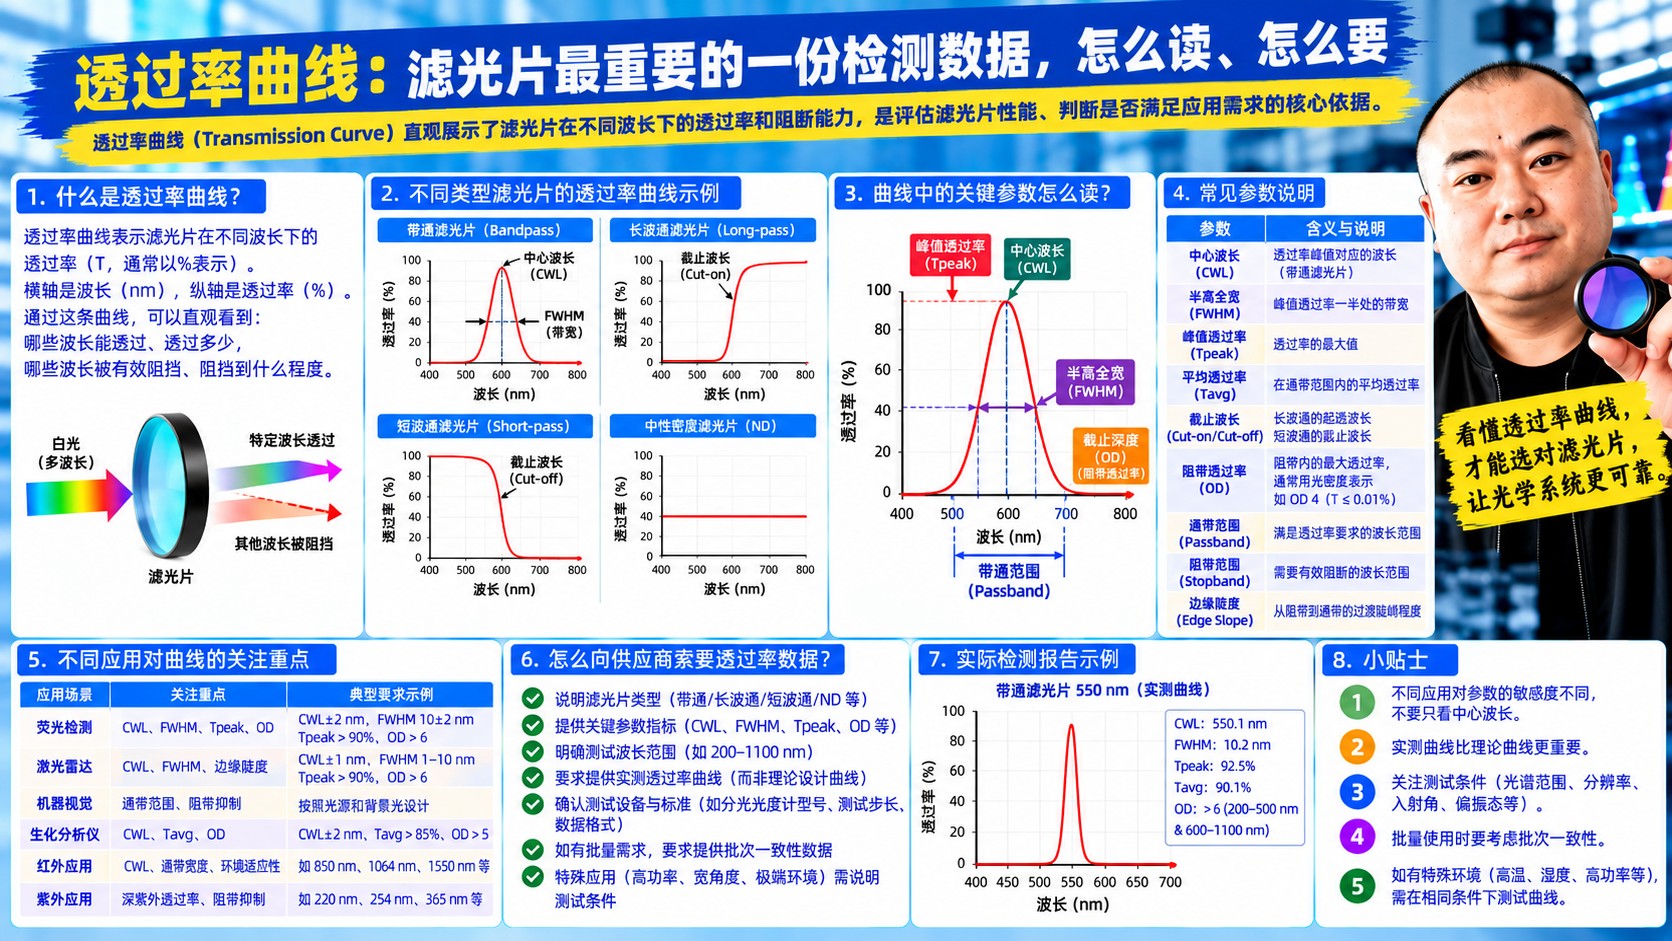
The transmission curve is transmission plotted against wavelength - the medical record of a filter, and the only raw data worth trusting when selecting, accepting or troubleshooting one.
Every number on a datasheet - CWL, FWHM, OD - was read off this curve. Learn to read the curve and no number can mislead you.
| Element | Common setting | Watch out for |
|---|---|---|
| Horizontal axis | Wavelength (nm or micrometers) | Does the range cover your entire stopband? |
| Vertical axis (linear) | Transmission %, 0-100 | Best for judging passband shape |
| Vertical axis (log) | OD, or log(%T) | Best for judging blocking depth; shows OD5 and OD6 |
Important: on a linear axis, OD4 (0.01%) is a line hugging zero and you cannot tell it from OD6; only a logarithmic axis separates them. Always ask for a log plot when evaluating blocking.
Beyond those, the curve reveals things no number can: whether the passband is flat-topped, how steep the edges are, whether sidebands leak, and whether the shape is symmetric.
Agree it at the purchasing stage:
With the CSV you can weight by your detector response and compute real signal-to-noise - more reliable than any datasheet figure.
Want a ready-to-use acceptance template? Contact sales@ootee.cn - we can ship measured data files in a standard format with your order.
 365nm Narrow Bandpass Filter | Ø50mm | T>90%
OT-HBP3659050
365nm Narrow Bandpass Filter; FWHM 10nm; transmission >90%; blocking OD5; size Ø50mm; AOI 0°.
 450nm Narrow Bandpass Filter | Ø50mm
OT-HBP4509050
450nm Narrow Bandpass Filter; FWHM 10nm; transmission >90%; blocking OD5; size Ø50mm; AOI 0°.
 525nm Narrow Bandpass Filter | Ø50mm
OT-HBP5259050
525nm Narrow Bandpass Filter; FWHM 10nm; transmission >90%; blocking OD5; size Ø50mm; AOI 0°.
Send us your drawing and spectral targets — an engineer replies with a feasibility check and quotation within one business day.